Dash Primordial Soup
When Plotly released Dash (almost 3 years ago), we were not certain that it would become the open-source phenomenon that Dash is today. Having 5 years of prior experience with plotly.js, plotly.R, and plotly.py — the world’s most downloaded, Web-based scientific graphing libraries for JavaScript, R, and Python (respectively) — there was reason for optimism, but early-stage open-source software (OSS) is notoriously fickle to launch.
For the 1st year of even the most promising OSS project, there be dragons ahead: Licensing, API changes, community support, getting to v1, and most importantly — long-term, sustainable project funding — are just a few of the challenges to navigate. On top of this, for an OSS project to reach a world-changing level of distribution (10’s of millions of downloads per year), you, your co-founders, and funders have to be committed for at least a decade. So while the (GitHub) stars seemed to align for Dash’s launch 3 years ago, Plotly approached the mercurial OSS gods with an appropriate level of foreboding and caution.
If we learned one thing while stewarding the Web’s scientific graphing libraries, it was that Plotly’s story wouldn’t end with interactive charts. Through Plotly, scientists, engineers, data scientists, and analysts had their first taste for interactive, Web-based charts and their imaginations went soaring. Plotly’s users wanted more…much more: sliders, dropdowns, search boxes, tables, and every “widget” imaginable was requested daily for years. Plotly had given scientists and engineers the ability to create D3 & WebGL charts in their lingua franca (Python, R, MATLAB, or Julia) — the Web was now open for business as a medium for scientific communication.

The React Connection
In the Unix spirit of “Do one thing, and do it well,” we knew Dash had to be a “user interface library” — separate and distinct from Plotly’s graphing libraries. Dash builds upon Plotly’s 8 years of scientific graphing library development but does not require them and works equally well with other graphing libraries.
To build the user interface layer of Python, R and Julia †, we teamed up with friends at Formidable. Formidable is known for world-class React application development and tooling. If a F500 company wants to rebuild their platform on React or retool a frontend engineering team, they call Formidable. In particular, through the builder task runner, Formidable helped us build Dash’s pipeline for converting React components to Dash components. With this toolchain, any React UI component could be automagically packaged as Python, R, or Julia library.
This is a subtle yet foundational idea for Dash: 1000’s of React user interface (UI) components live on npm. With Dash, any open-source React UI component can be pulled from npm or GitHub, stirred with water, transmogrified into a Dash component, then imported into your Dash app as a Python, R, or Julia library. C’est magnifique! 👨🍳 Dash makes the richness and innovation of the React frontend ecosystem available to Python, R, and Julia engineers for the first time.
Dash makes the richness and innovation of the React frontend ecosystem available to Python, R, and Julia engineers for the first time
.
Behind the scenes, when a Python, R or Julia engineer creates a Dash app, they are actually creating a React Single Page Application (“SPA”). React SPAs have become the default paradigm for shipping complicated Web applications (e.g. Facebook) because of React’s performance, code maintainability, serverless architecture, developer tools, enforced data flow, and vast ecosystem of open-source components. Despite React’s popularity, very few engineers or scientists outside Web development have the time to learn this framework. It takes 3–6 months to become a decent React frontend engineer (assuming prior programming experience) — a luxurious time investment that most engineers and scientists can’t afford. Even for data scientists who have frontend programming skills, it’s too time consuming to develop a full-stack application on top of the data science and AI models that the apps run. Enter Dash: the tool that enables Python, R, and Julia engineers to create uncompromising React SPAs — no JavaScript required.
The Fatiguing Tedium of the Transport Layer
Even if you’re a full-stack developer and React expert, you still have to design an API that allows the frontend and backend(s) to communicate. In CRUD-style Web apps, this is facilitated through protocols like REST and GraphQL. Designing this API (or “transport layer”) for interactive apps and dashboards that require frequent, fast, and fine-grained updates can be challenging and tedious.
For example, imagine that your React app needs to dynamically update the options within a dropdown. First, you import your favorite React dropdown library and add a dropdown to your React render method. Easy enough, but now you have to work backwards and wire this dropdown into the transport layer: write the async (fetch) calls in JavaScript, add the new routes on the backend, serialize the data for transport, display a loading state, etc…
In Dash, this tedium is all done for you automagically. You don’t even need to think about it. The transport layer as well as the frontend layer is abstracted through Dash’s intuitive callback registry. Even for an experienced Python data scientist, it takes 3–6 months to become a proficient back-end API programmer — another luxurious time investment that most engineers and scientists can’t afford.
Still with us? We haven’t even mentioned deploying these tedious changes while ensuring nothing breaks… For this, we recommend taking a Dash Enterprise trial for a spin.
Embracing React is a Dash Architectural Principle
Through all of Dash’s releases, we’ve been determined to set Dash app developers on a path of long-term success. We’ve baked every hard-earned software engineering lesson, from our team’s decades of cumulative experience, into Dash’s architecture. This includes embracing React for robust and scalable frontend engineering.
Dash applications are not computational notebooks or markdown files with data science code interspersed among widgets. Instead, Dash apps are regular Python, R and Julia files that cleanly separate UI code from application logic. This means that Dash apps can be easily modularized, checked into source-control, diffed, reviewed using best-practices like Pull Request Reviews, and unit-tested to ensure quality and minimize regressions.
The Python-to-React Pipeline of your Dreams
How far can we take this? One dream for Dash is a full-scale React-to-[Python-R-Julia] pipeline. Why settle for “dashboarding,” when Dash could be the user interface standard for any ML, AI, pure science, or engineering app? As this astute Dash community member observed:
It seems like there’s a lot of developer activity and momentum to grow the [Dash] framework into a general purpose Python-to-React transpiler for a wide variety of [server side rendering] applications. IMHO it is already very close, maybe 80% close, to being a better choice than Django for most SPA applications. I’m looking forward to telling my developer friends next year, “Heck, I’ve been using Dash since the early days — back when it was just a container for Plotly figures!”
With JavaScript lazy loading, pattern-matching callbacks, optimized caching, clientside updates, multi-page apps, loading states, persisting user inputs, and a series of React-to-[Py, R, Jl] toolchain improvements, we have our eyes to the stars: Dash will be the Python-to-React pipeline of our dreams in 2020.

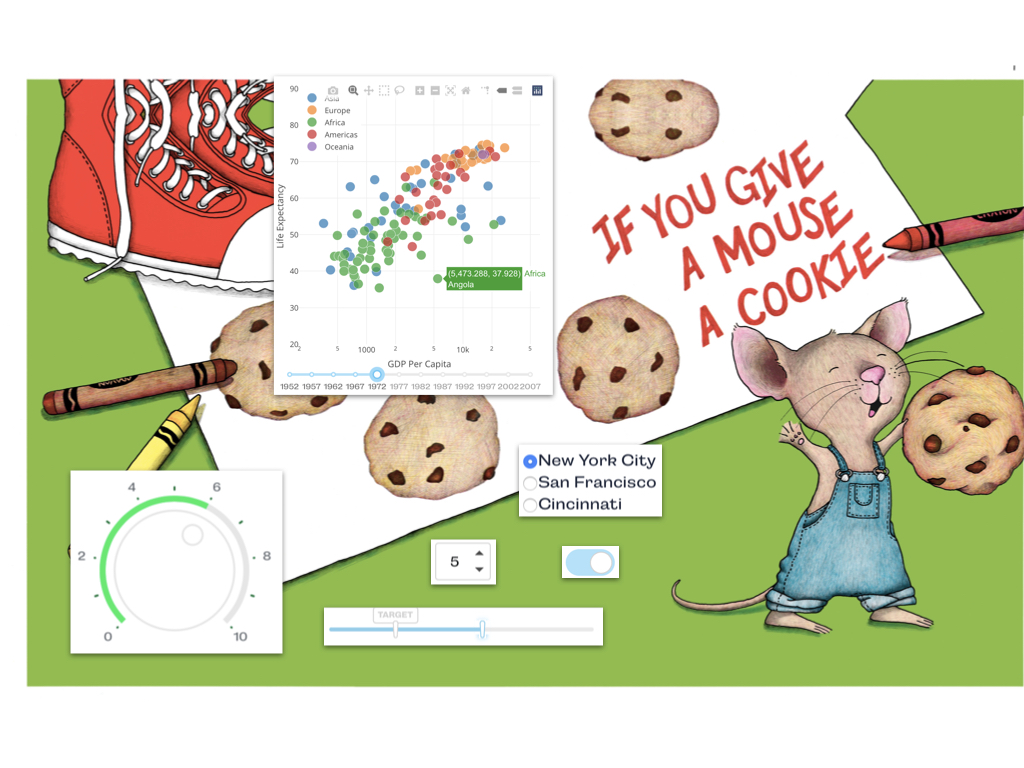
For developer velocity, Dash comes with more than 30 out-of-the-box React components, packaged as the Dash Core and Dash DAQ libraries. For Dash DAQ, we teamed up with friends at Dawn Labs — another legendary React shop.
We’ve also seen Dash users create their own components, either from preexisting React libraries or (most impressively) completely from scratch. Here are a few of our faves:
- 🧬 Autodesk 3d molecule viewer — React component ➡️ Dash component
- 📈 Highcharts — React components ➡️ Dash components
- 🌈 Color scale picker — React component ➡️ Dash component
- 🏋️ Large file upload — React component ➡️ Dash component
- 🥾Bootstrap suite — React components ➡️ Dash components
- 📊 Pivot table — React component ➡️ [Get in touch for] Dash component
- 🎨 Chart editor — React component ➡️ [Get in touch for] Dash component
Most people are surprised to learn that of Plotly’s 50 engineers, the vast majority are React developers. This is because Dash is primarily a frontend library — there are far more lines of JavaScript (Typescript) than Python, R, or Julia code. Plotly only has 3 full-time Python developers, 2 full-time R developers, and 0 full-time Julia developers. This is because the heavy lifting for a library like Dash is in JavaScript. To make Dash language agnostic, we needed to pack the logic into the frontend with a small API surface area. This keeps the Python, R, and Julia bindings to the Dash frontend thin, uniform, testable, and manageable. Plotly engineers are expert React developers so that Dash Python, R, and Julia users don’t have to be.
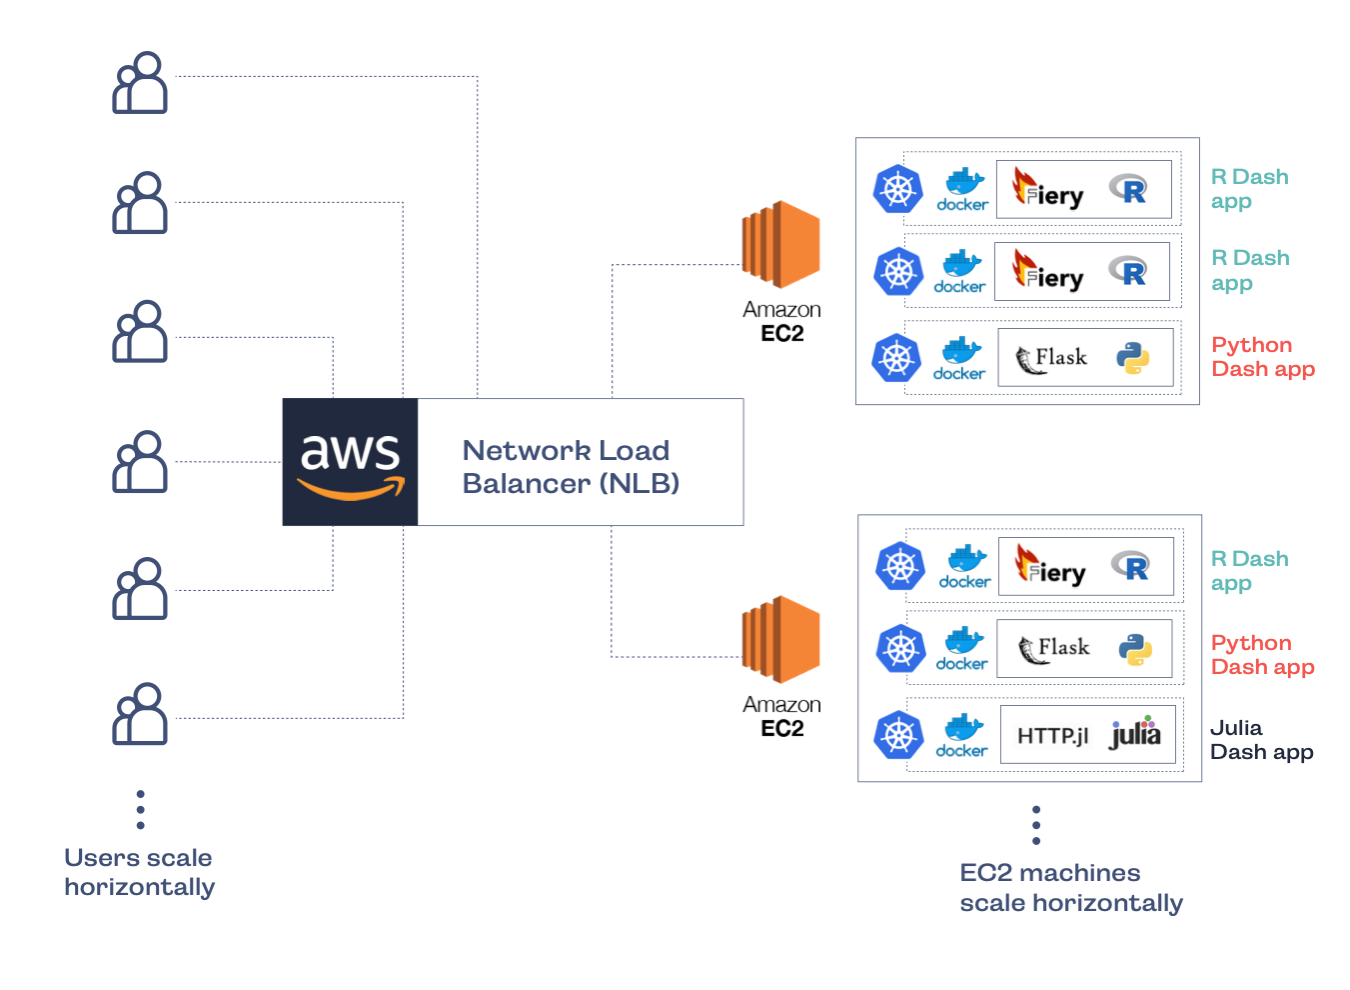
The next largest engineering team at Plotly is devops, because once you’ve made your first killer Dash app, you need scalable infrastructure to host it. For this, Plotly’s devops team develops Dash Enterprise, a Kubernetes platform that enables automatic horizontal scaling and world-class hosting performance for Dash applications.

Have a React component or React component library that you want published as a Dash component? Want to improve Dash’s React-to-Python pipeline? Give us a shout to discuss your ideas and vision.
† Julia Computing and Plotly have quietly taken first steps to support Julia as a first-class Dash backend. Be on the lookout for an announcement next month, or get in touch to ⚡accelerate the development ⚡