Below are 10 charts made in R or Python by Plotly users on weather, maps and geography.
1. Doctor Who? – Timelords weather forecast for different cities
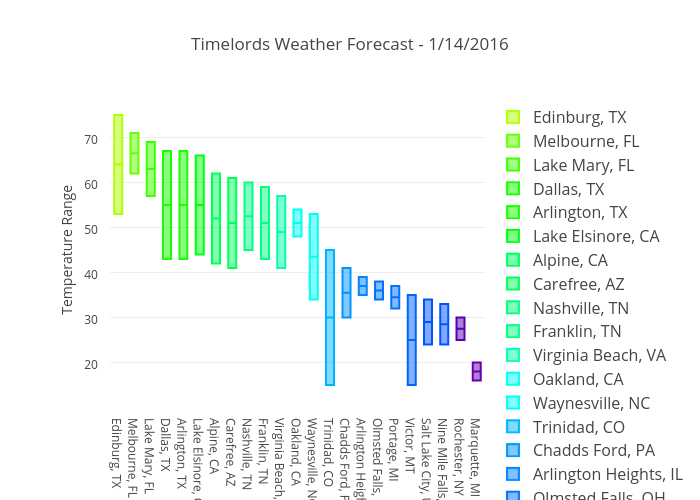
Chart Link: https://plot.ly/~wthrmn/30/timelords-weather-forecast-1152016/
Chart Author: @ wthrmn
Touched up in: Plotly online editor
Code: Python code R Code
2. Its raining ! – US Precipitation (June 2015)
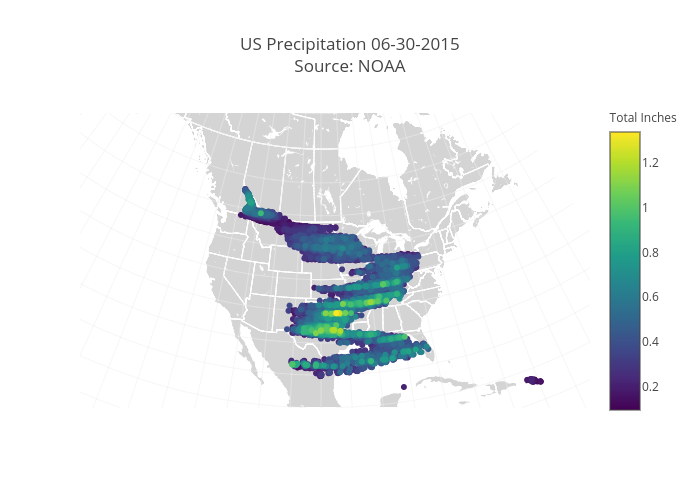
Chart Link: https://plot.ly/~RPlotBot/334/us-precipitation-06-30-2015-source-noaa/
Chart Author: @ RPlotBot
Touched up in: Plotly online editor
Code: Python code R Code
3. Yikes, its windy ! – Origin of Tropical Cyclones
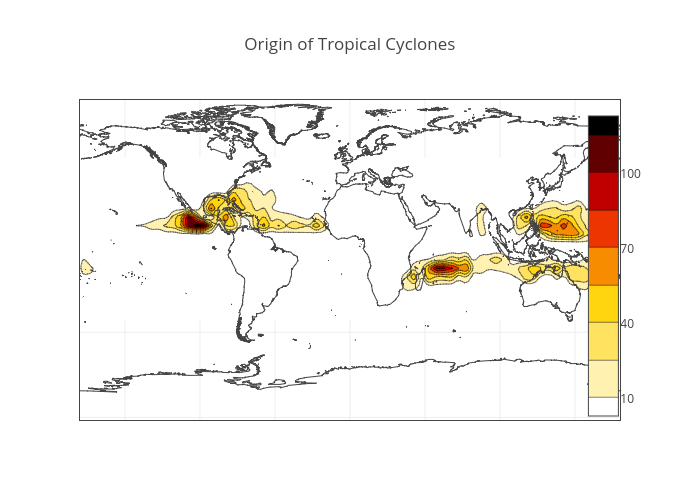
Chart Link: https://plot.ly/~ToniBois/3306/origin-of-tropical-cyclones/
Chart Author: @ ToniBois
Touched up in: Plotly online editor
Code: Python code R Code
4. Start the new year with some clouds – Cloud cover for Jan 15th 2016
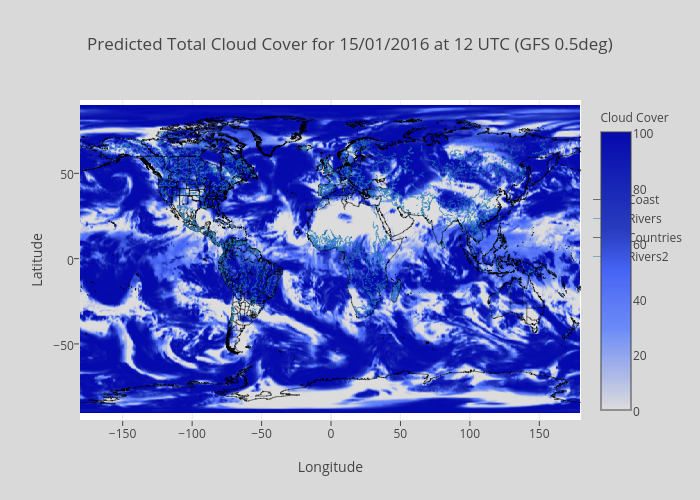
Chart Link: https://plot.ly/~ToniBois/3258/predicted-total-cloud-cover-for-15012016-at-12-utc-gfs-05deg
Chart Author: @ ToniBois
Touched up in: Plotly online editor
Code: Python code R Code
5. Skiing anyone? – Predicted Snow Depth on Jan 15th 2016
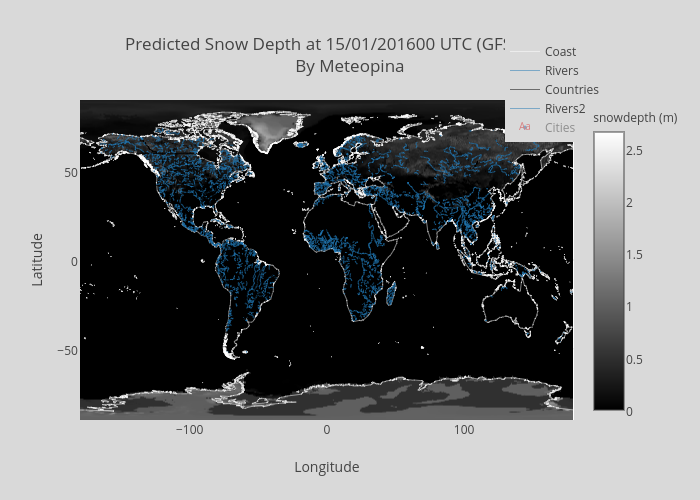
Chart Link: https://plot.ly/~ToniBois/3260/predicted-snow-depth-at-1501201600-utc-gfs-05deg-by-meteopina
Chart Author: @ ToniBois
Touched up in: Plotly online editor
Code: Python code R Code
6. Winds picking up… – Wind speed Rose Chart
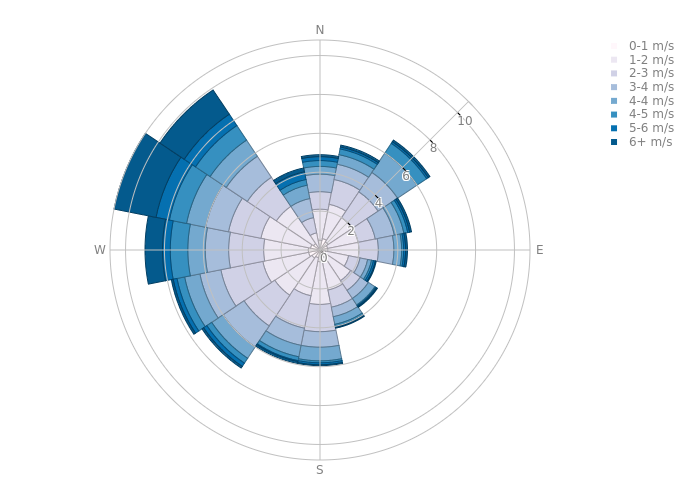
Chart Link: https://plot.ly/~jackp/11726/_0-1-ms-1-2-ms-2-3-ms-3-4-ms-4-4-ms-4-5-ms-5-6-ms-6-ms/
Chart Author: @ jackp
Touched up in: Plotly online editor
Code: Python code R Code
7. Look its a bird ! – Anna Hummingbird – First Occurence Report
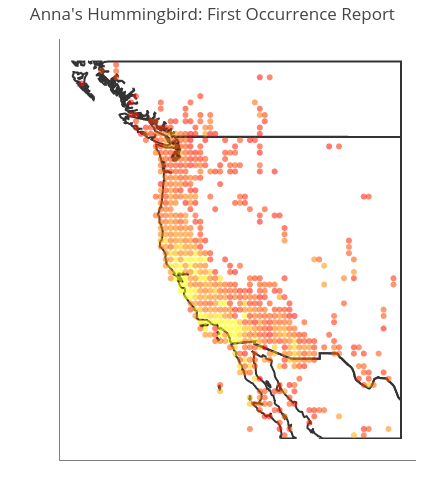
Chart Link: https://plot.ly/~cjbattey/111/annas-hummingbird-first-occurrence-report
Chart Author: @ cjbattey
Touched up in: Plotly online editor
Code: Python code R Code
8. Put your 3d glasses on ! – World 3D map
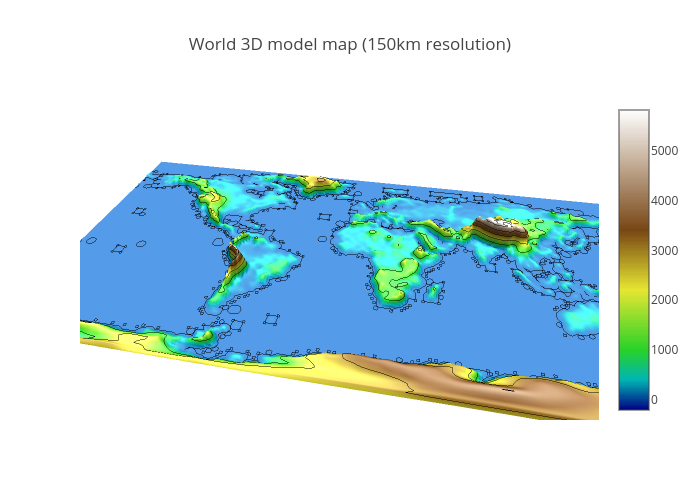
Chart Link: https://plot.ly/~etpinard/7326/world-3d-model-map-150km-resolution
Chart Author: @ etpinard
Touched up in: Plotly online editor
Code: Python code R Code
9. Contour lines over globe
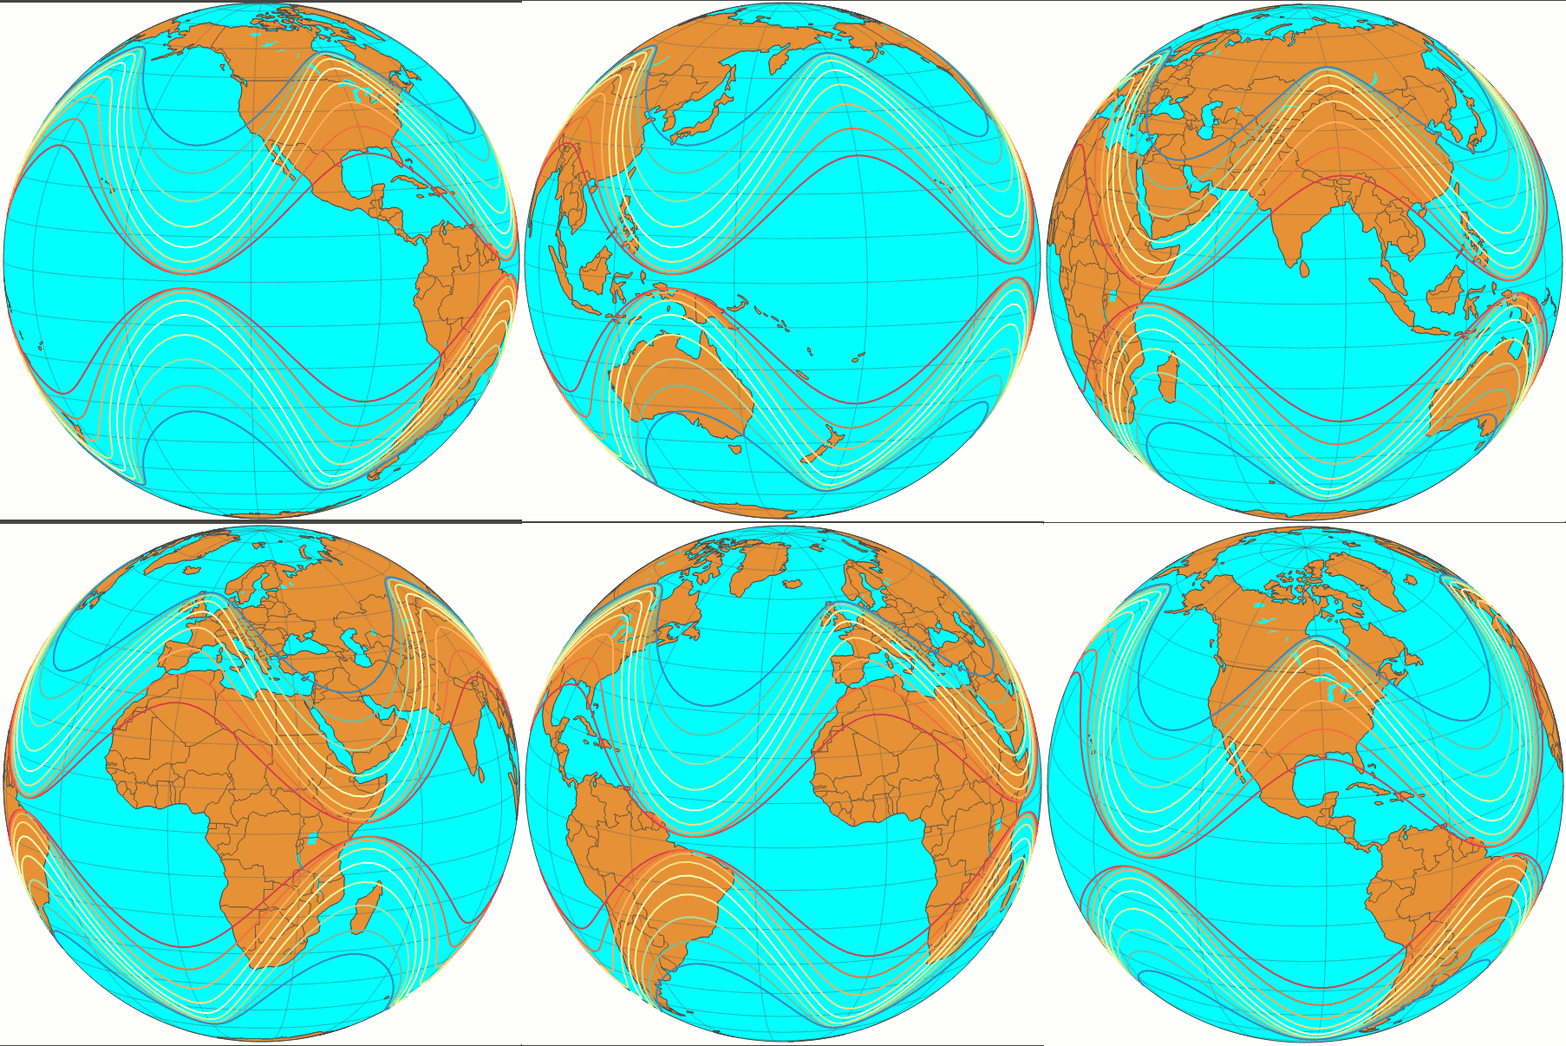
Chart Link: https://plot.ly/~jackp/8612/contour-lines-over-globe-click-and-drag-to-rotate
Chart Author: @ jackp
Touched up in: Plotly online editor
Code: Python code R Code
10. Okay that’s cool – Bubble world population map
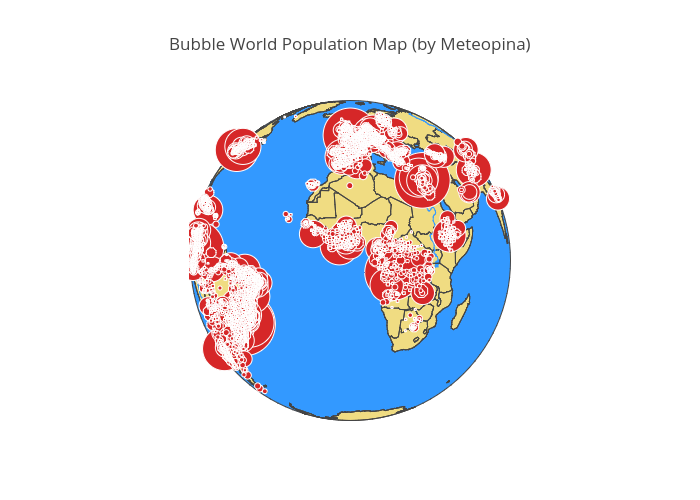
Chart Link: https://plot.ly/~ToniBois/3244/bubble-world-population-map-by-meteopina
Chart Author: @ ToniBois
Touched up in: Plotly online editor
Code: Python code R Code
Head on over to Plotly and create your own interactive chart !