Below are 15 charts made in Plotly or using Ploty’s APIs by users on Brand and consumer Research.
1. So what if I’m old – Brand choices for Age > 60
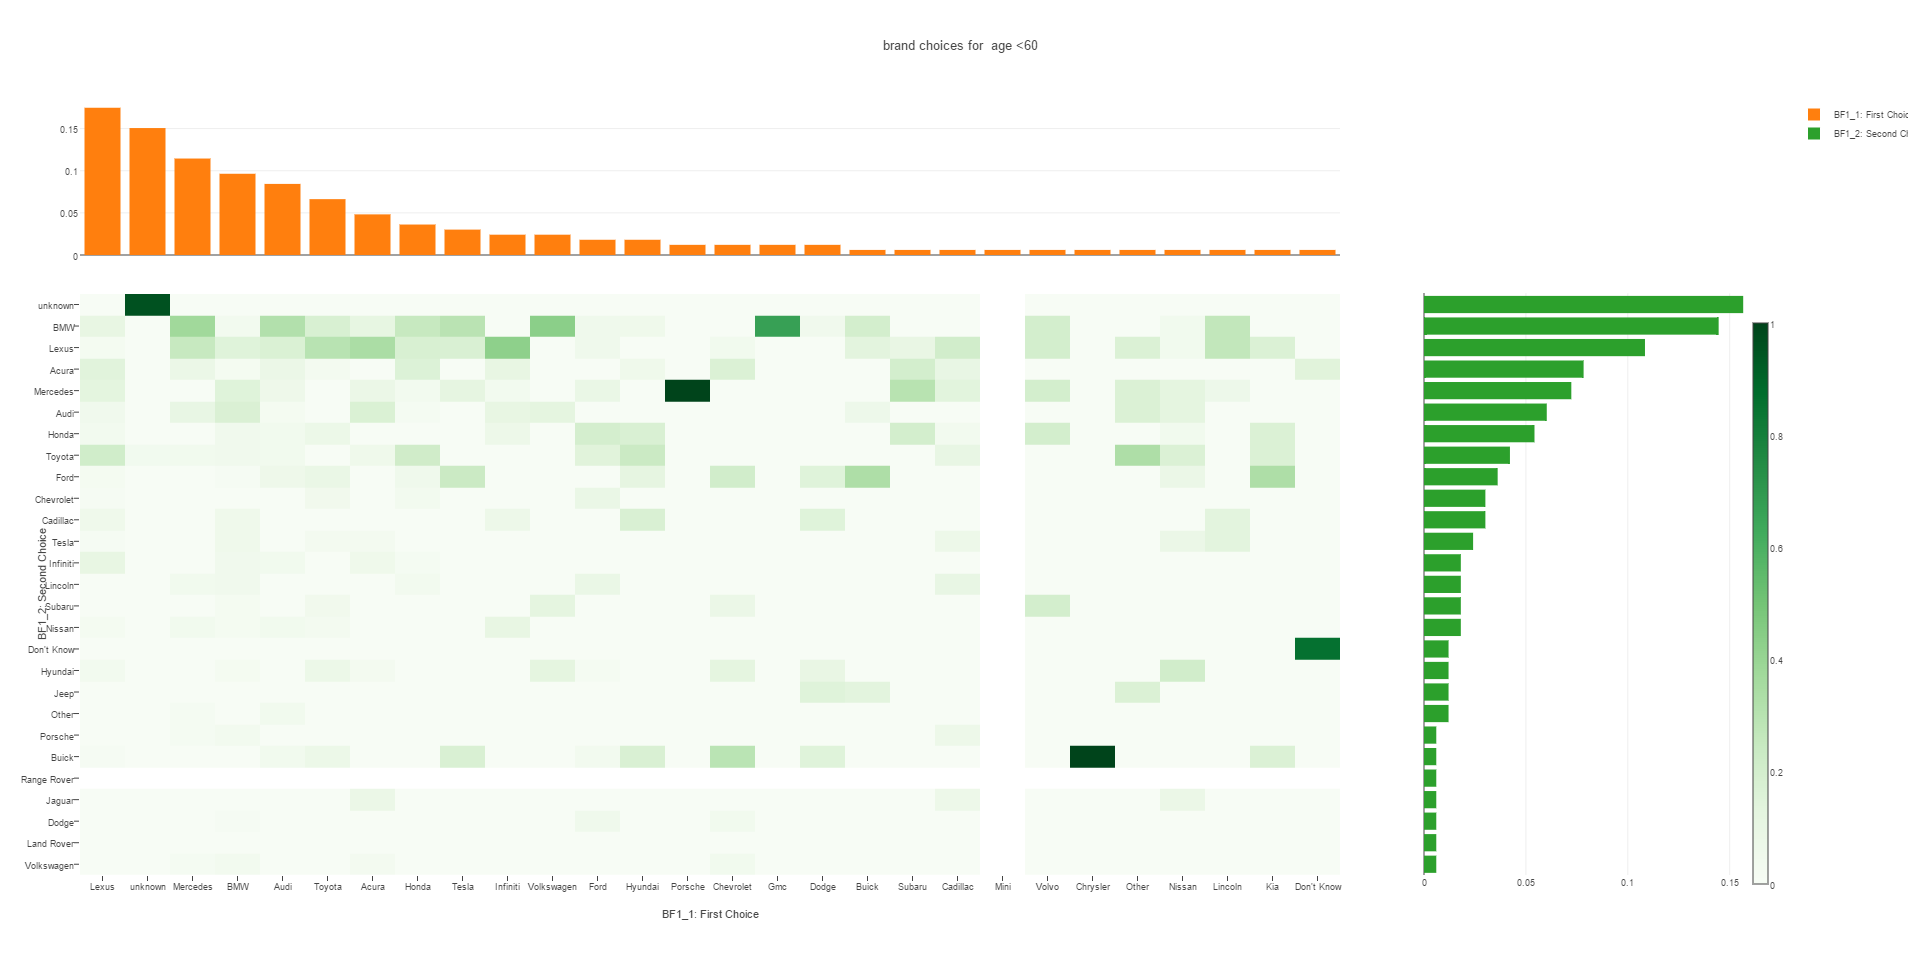
Chart Link: https://plot.ly/~snawel/80/brand-choices-for-age-60/
Chart Author: @ snawel
Touched up in: Plotly online editor
Code: Python code R Code
2. DND, I am watching TV – Nielson Rating for Top TV shows by season (1960-2015)
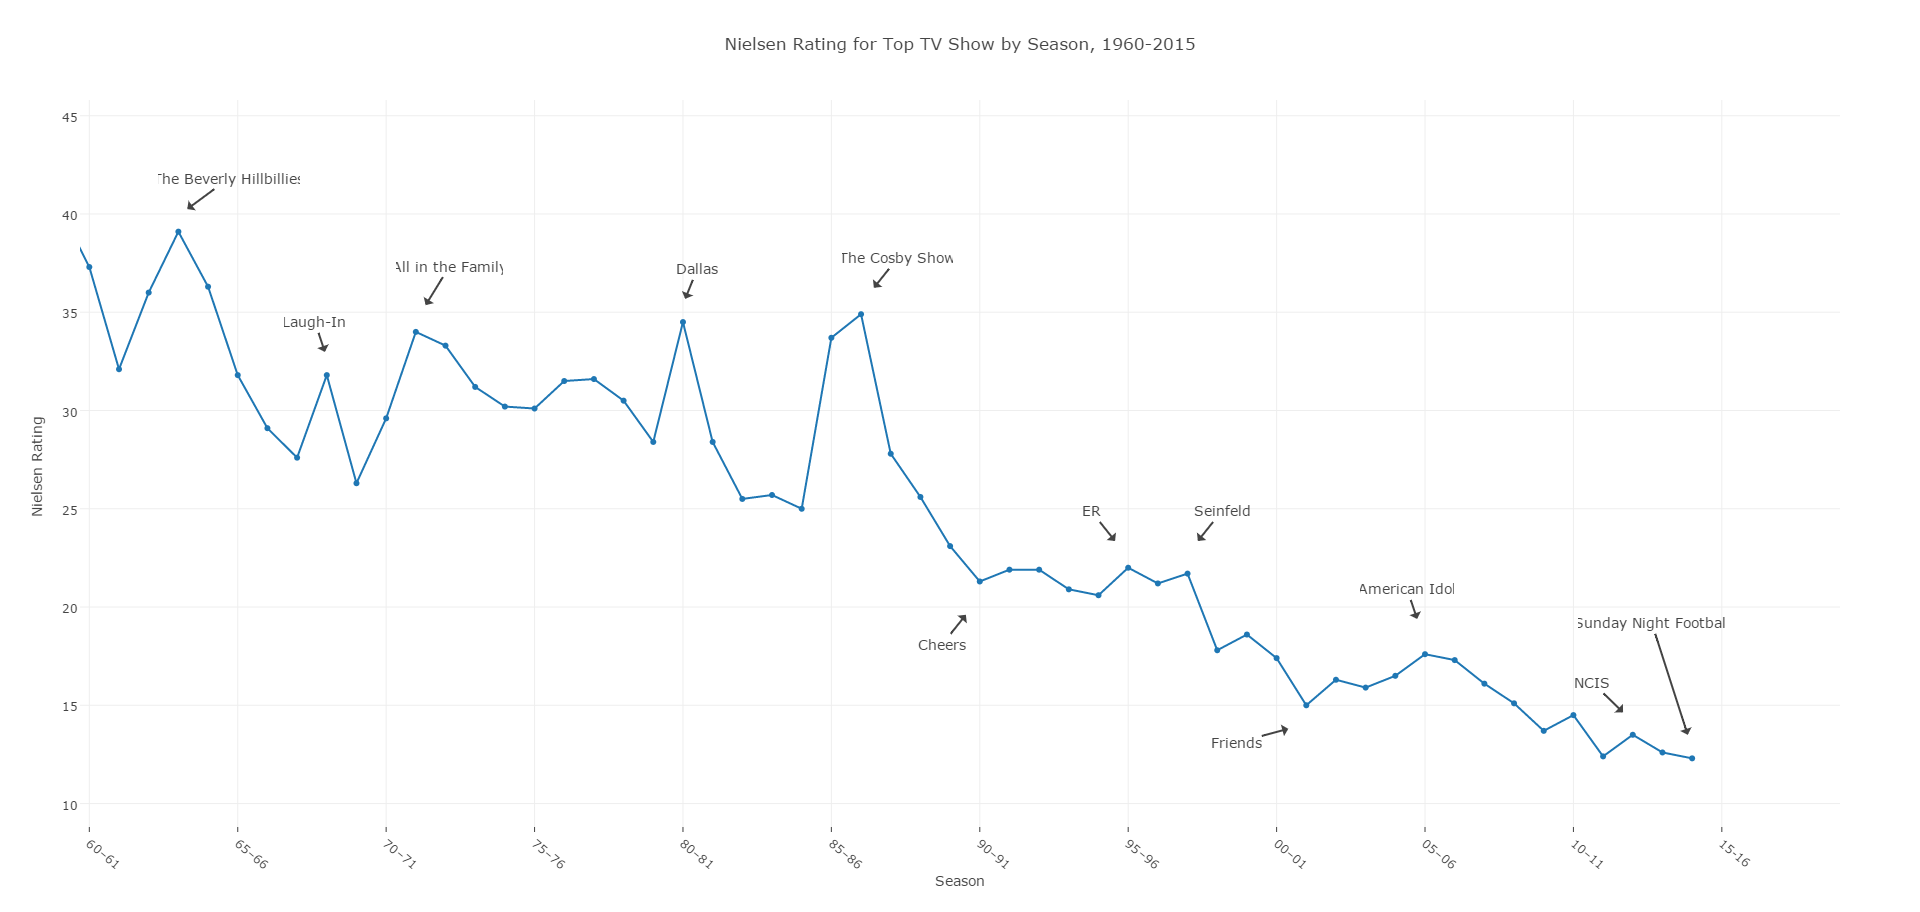
Chart Link: https://plot.ly/~tccorrigan1/9
Chart Author: @ tccorrigan
Touched up in: Plotly online editor
Code: Python code R Code
3. Look at my new Ride(s) ! – First and Second Car Brand Choices
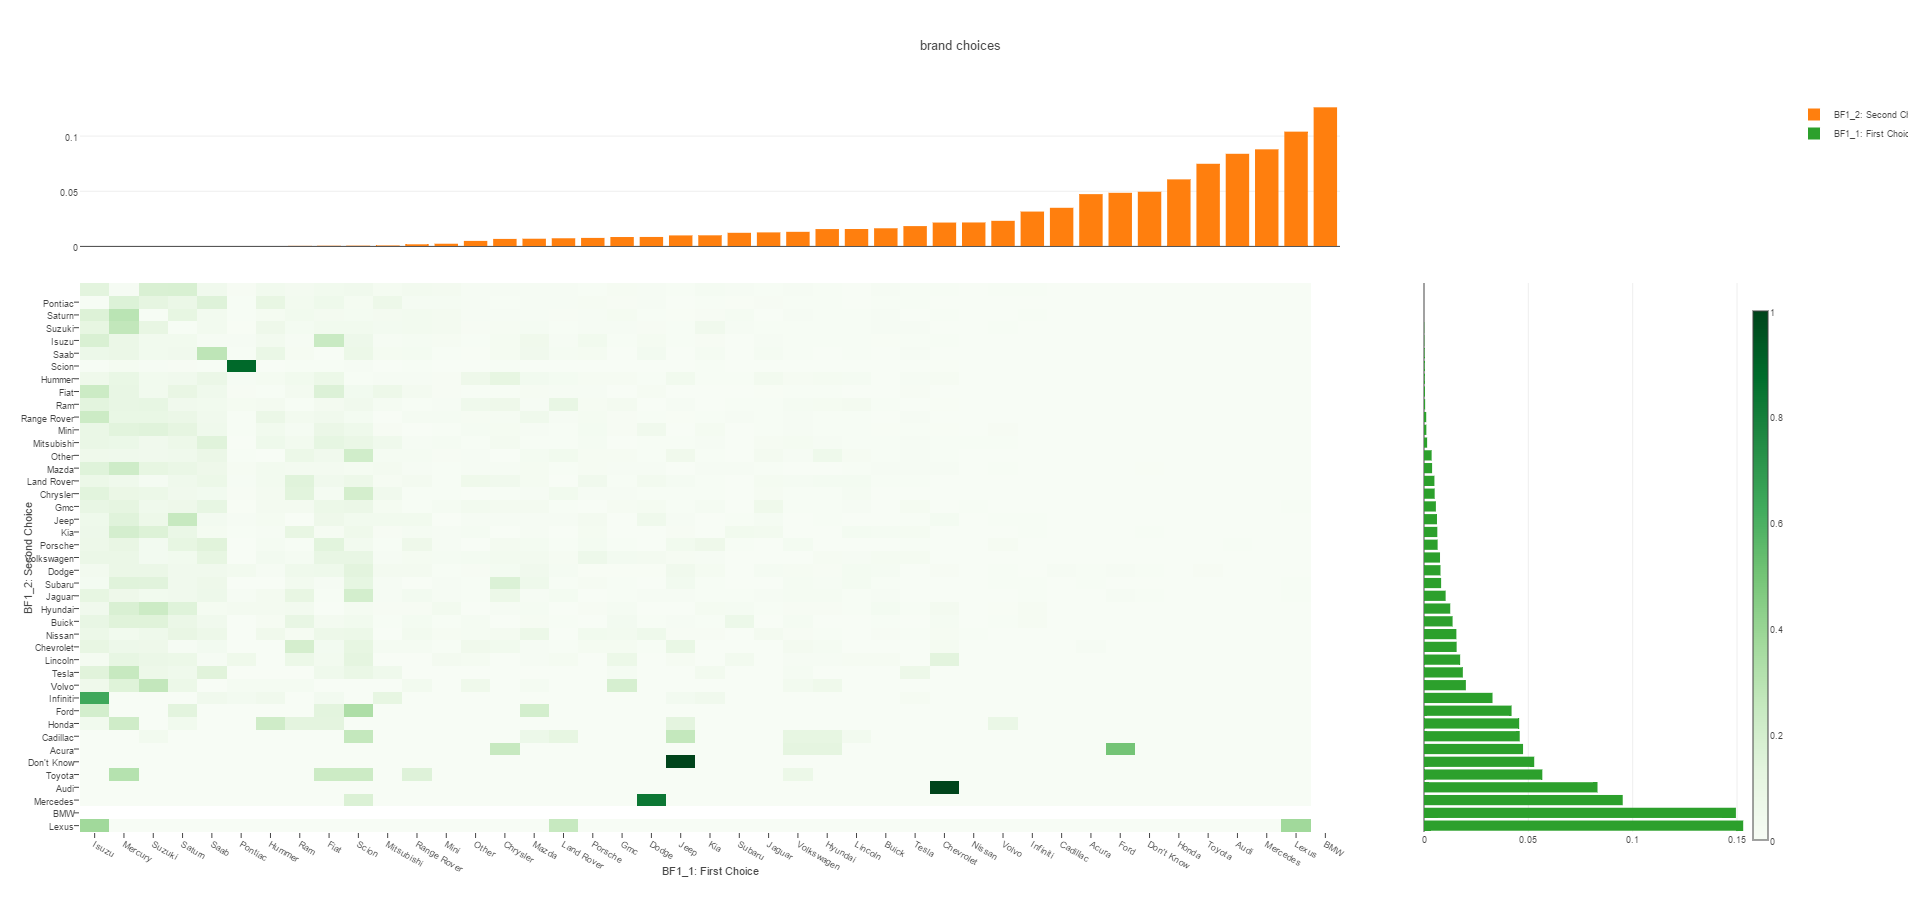
Chart Link: https://plot.ly/~snawel/32/brand-choices/
Chart Author: @ snawel
Touched up in: Plotly online editor
Code: Python code R Code
4. More views or better ratings? – Neilson viewership and IMDB ratings histograms
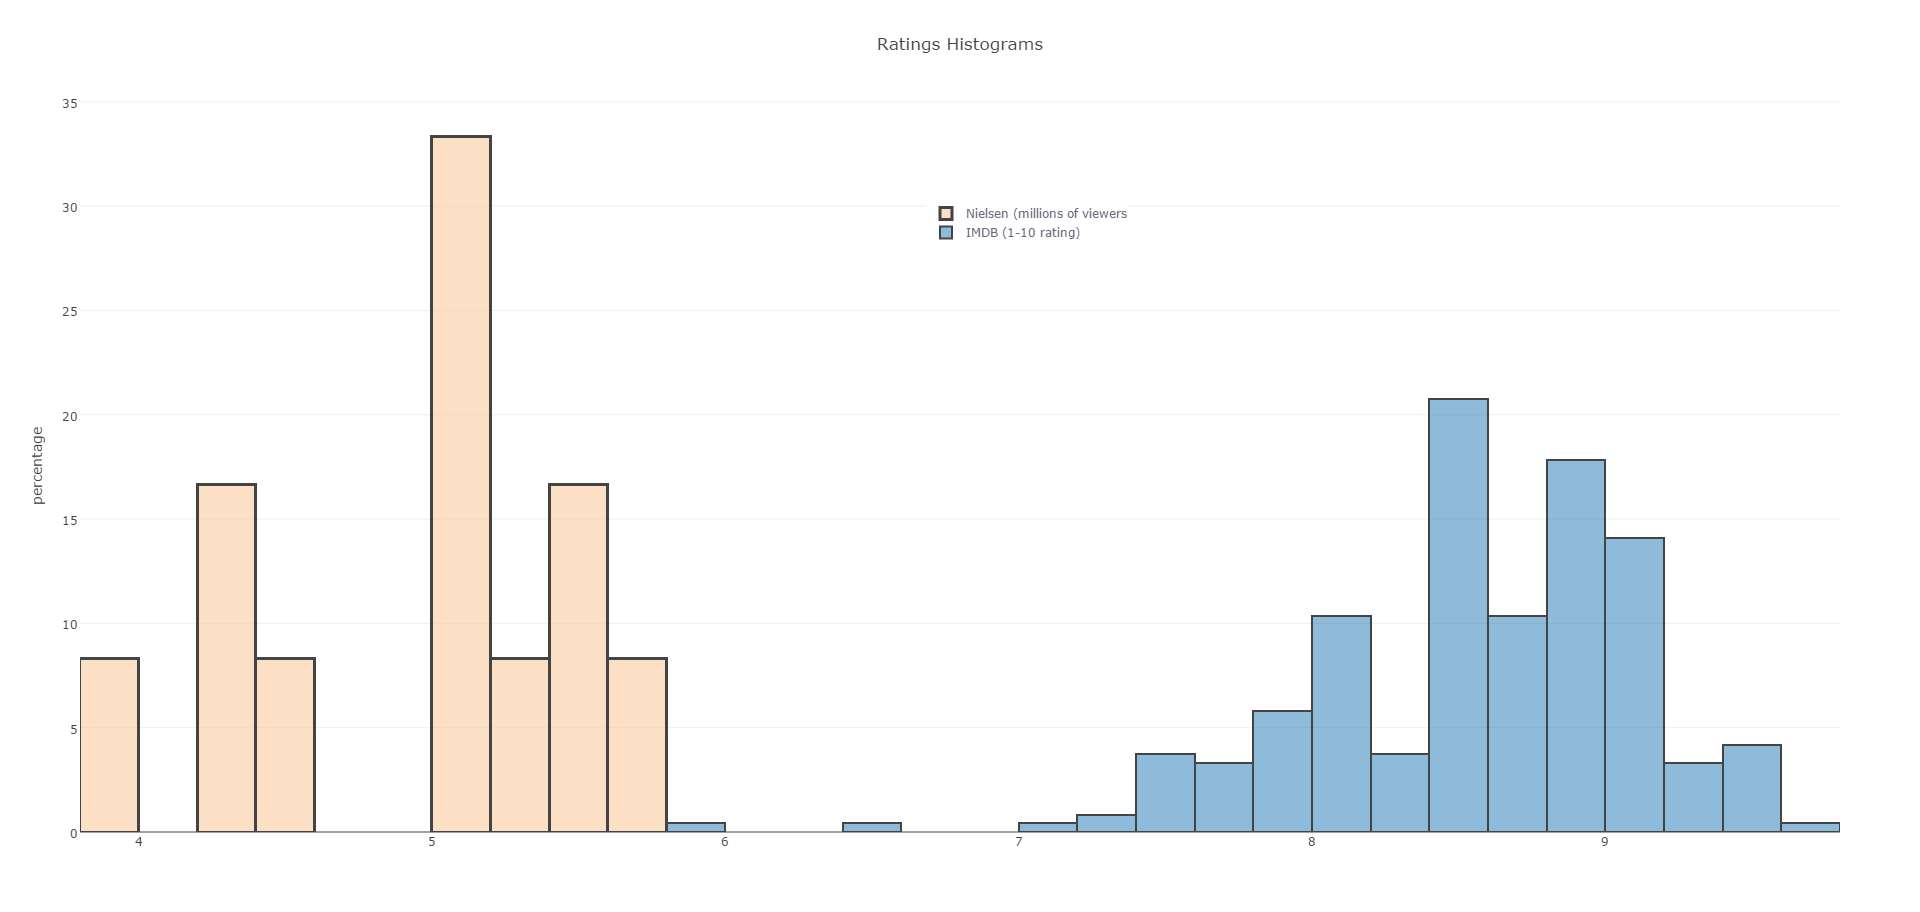
Chart Link: https://plot.ly/~messier51/32/ratings-histograms/
Chart Author: @ messier51
Touched up in: Plotly online editor
Code: Python code R Code
5. Schhwaff, Swoosh and Abracadabra – Neilson Ratings for Arrow, The Flash and Supernatural (2014/2015)
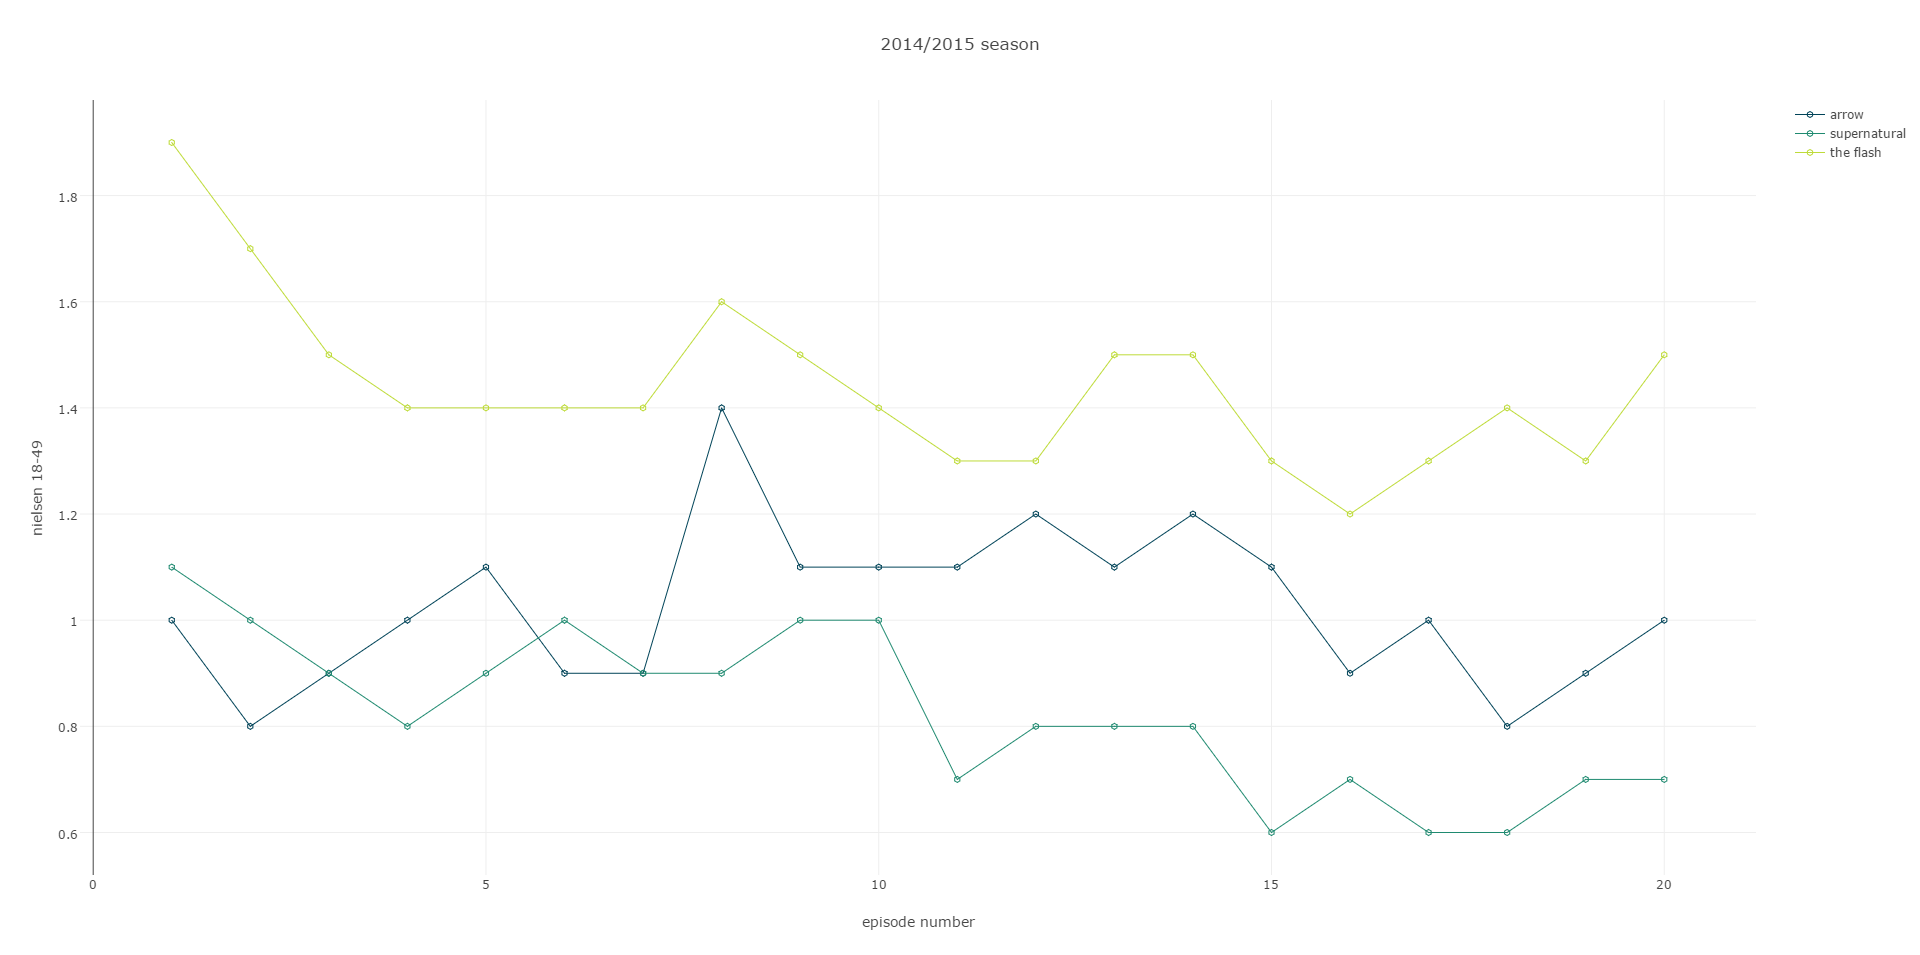
Chart Link: https://plot.ly/~messier51/7/_20142015-season/
Chart Author: @ messier51
Touched up in: Plotly online editor
Code: Python code R Code
6. Vrooooom – Heatmap for car brand choices
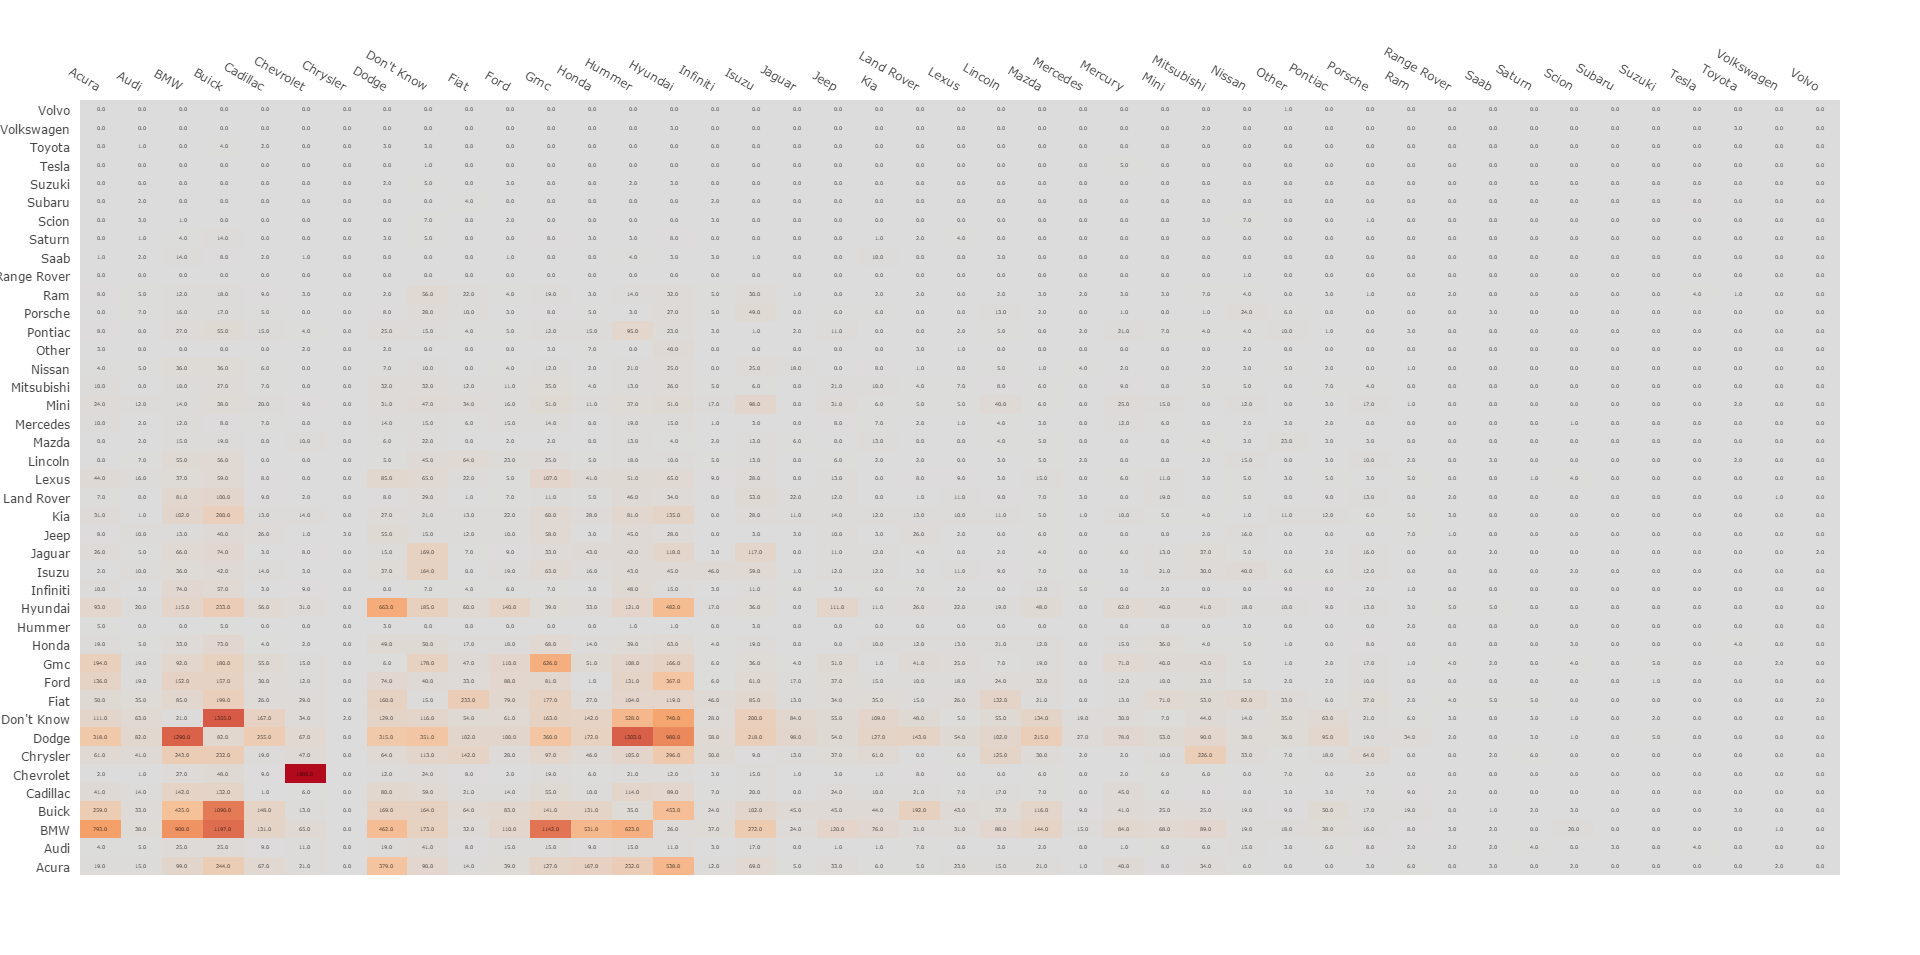
Chart Link: https://plot.ly/~nawel/340
Chart Author: @ nawel
Touched up in: Plotly online editor
Code: Python code R Code
7. Got a light? – Cigarette Brand Preference by Country
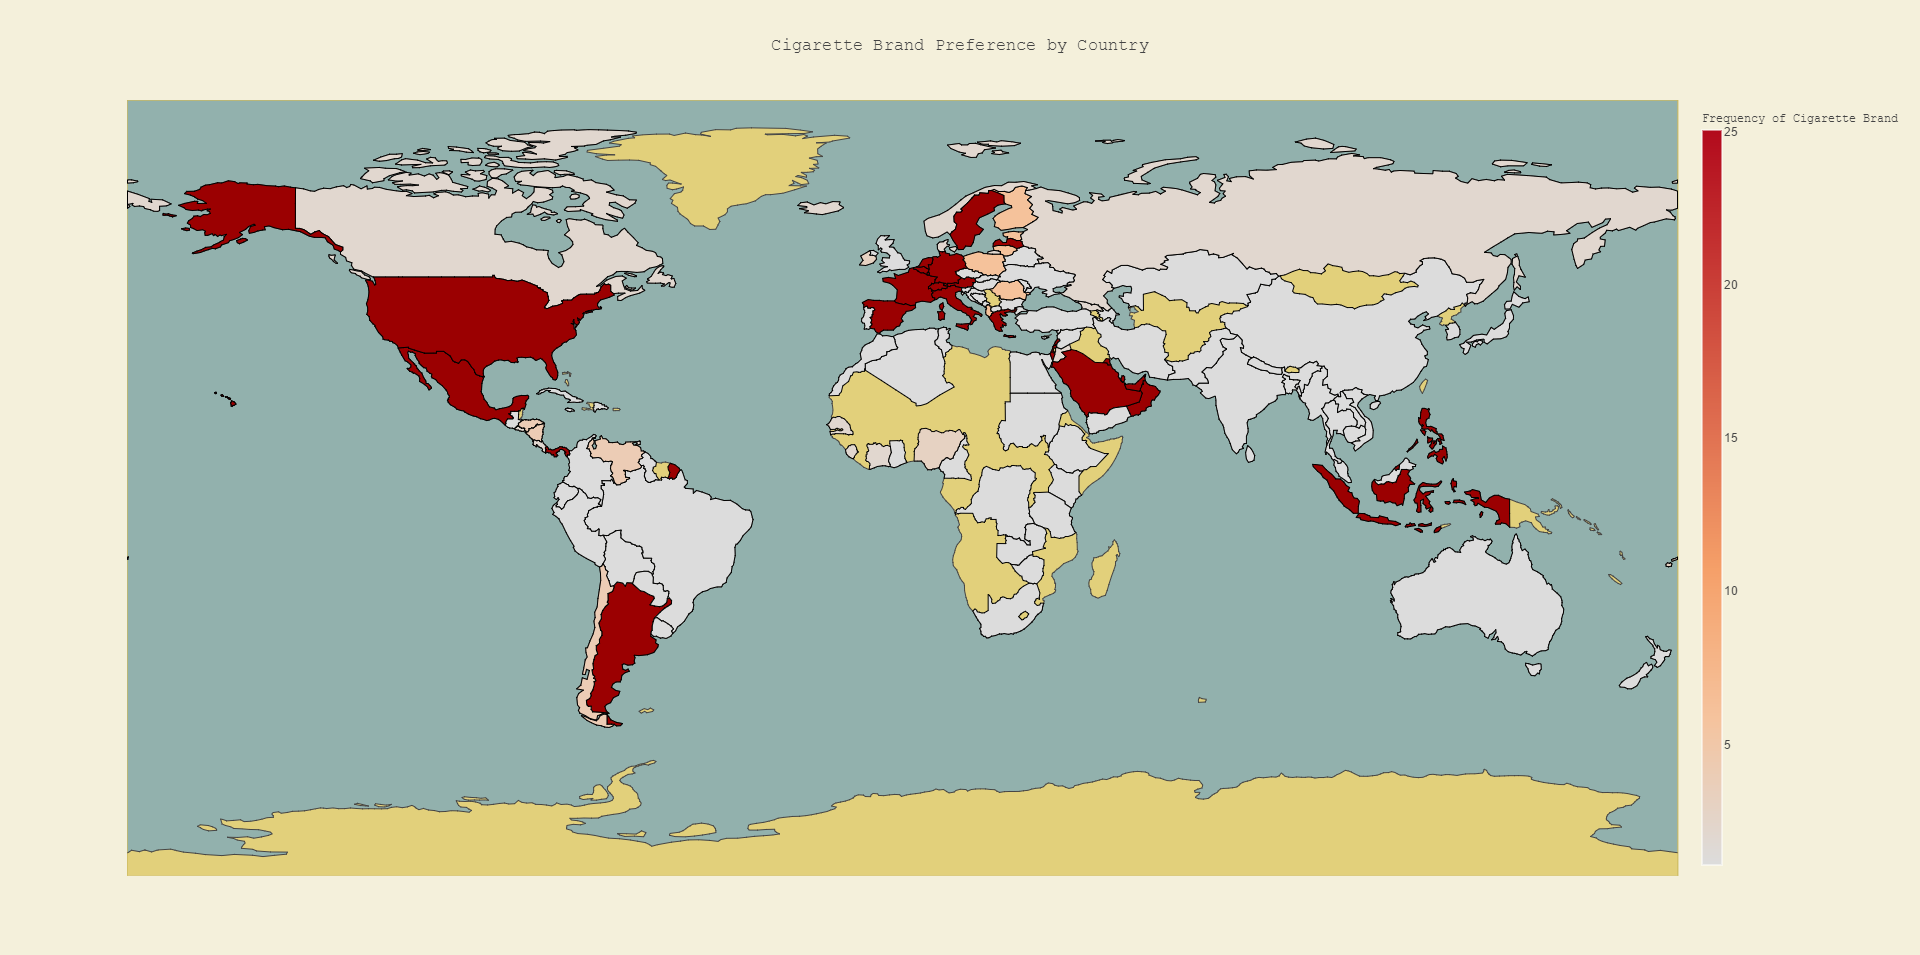
Chart Link: https://plot.ly/~etav3/49/cigarette-brand-preference-by-country/
Chart Author: @ etav3
Touched up in: Plotly online editor
Code: Python code R Code
8. You like Marlborough? Me too ! – Most Popular Cigarette brands Globally
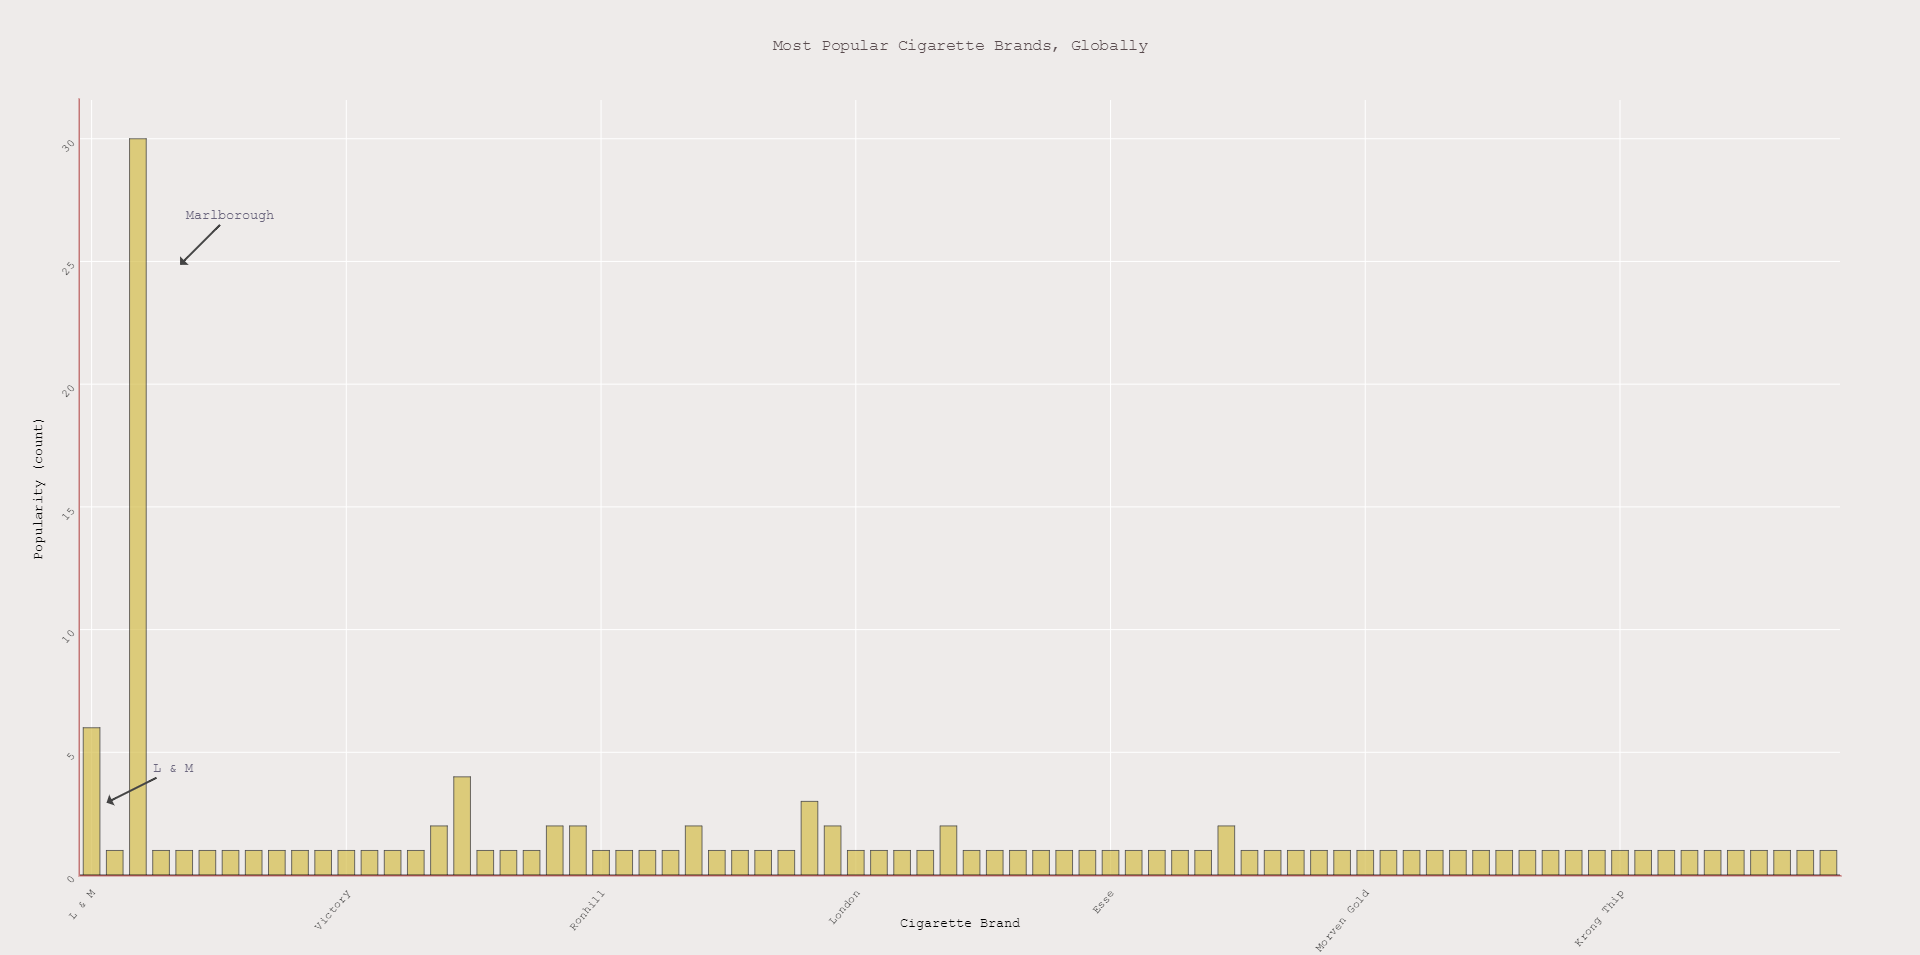
Chart Link: https://plot.ly/~etav3/52/most-popular-cigarette-brands-globally/
Chart Author: @ etav3
Touched up in: Plotly online editor
Code: Python code R Code
9. What’s Reputation Quotient? – The Reputations of the 100 Most Visible Companies Among the General Public
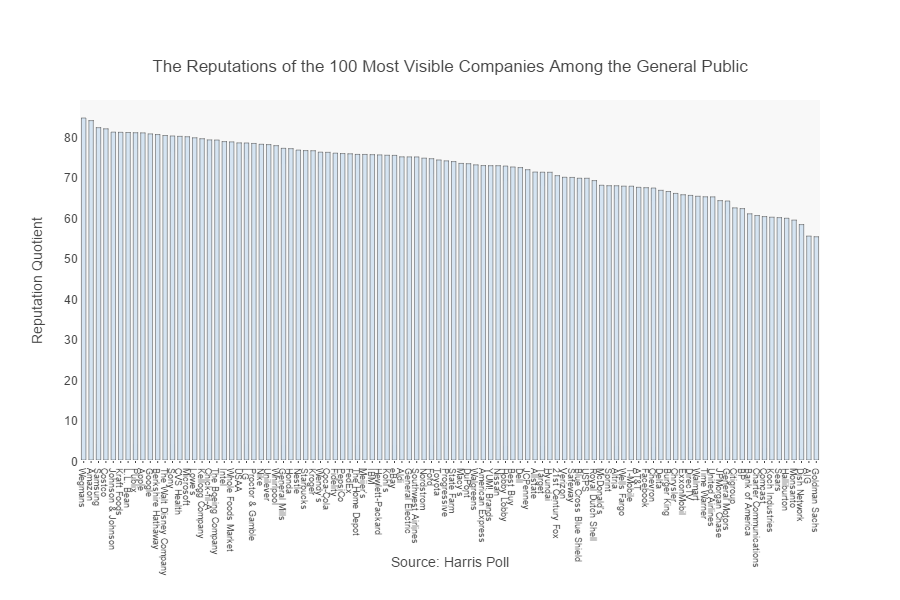
Chart Link: https://plot.ly/~Dreamshot/1677/the-reputations-of-the-100-most-visible-companies-among-the-general-public/
Chart Author: @ Dreamshot
Touched up in: Plotly online editor
Code: Python code R Code
10. Where’s my iPhone at? – Apple Product Mix
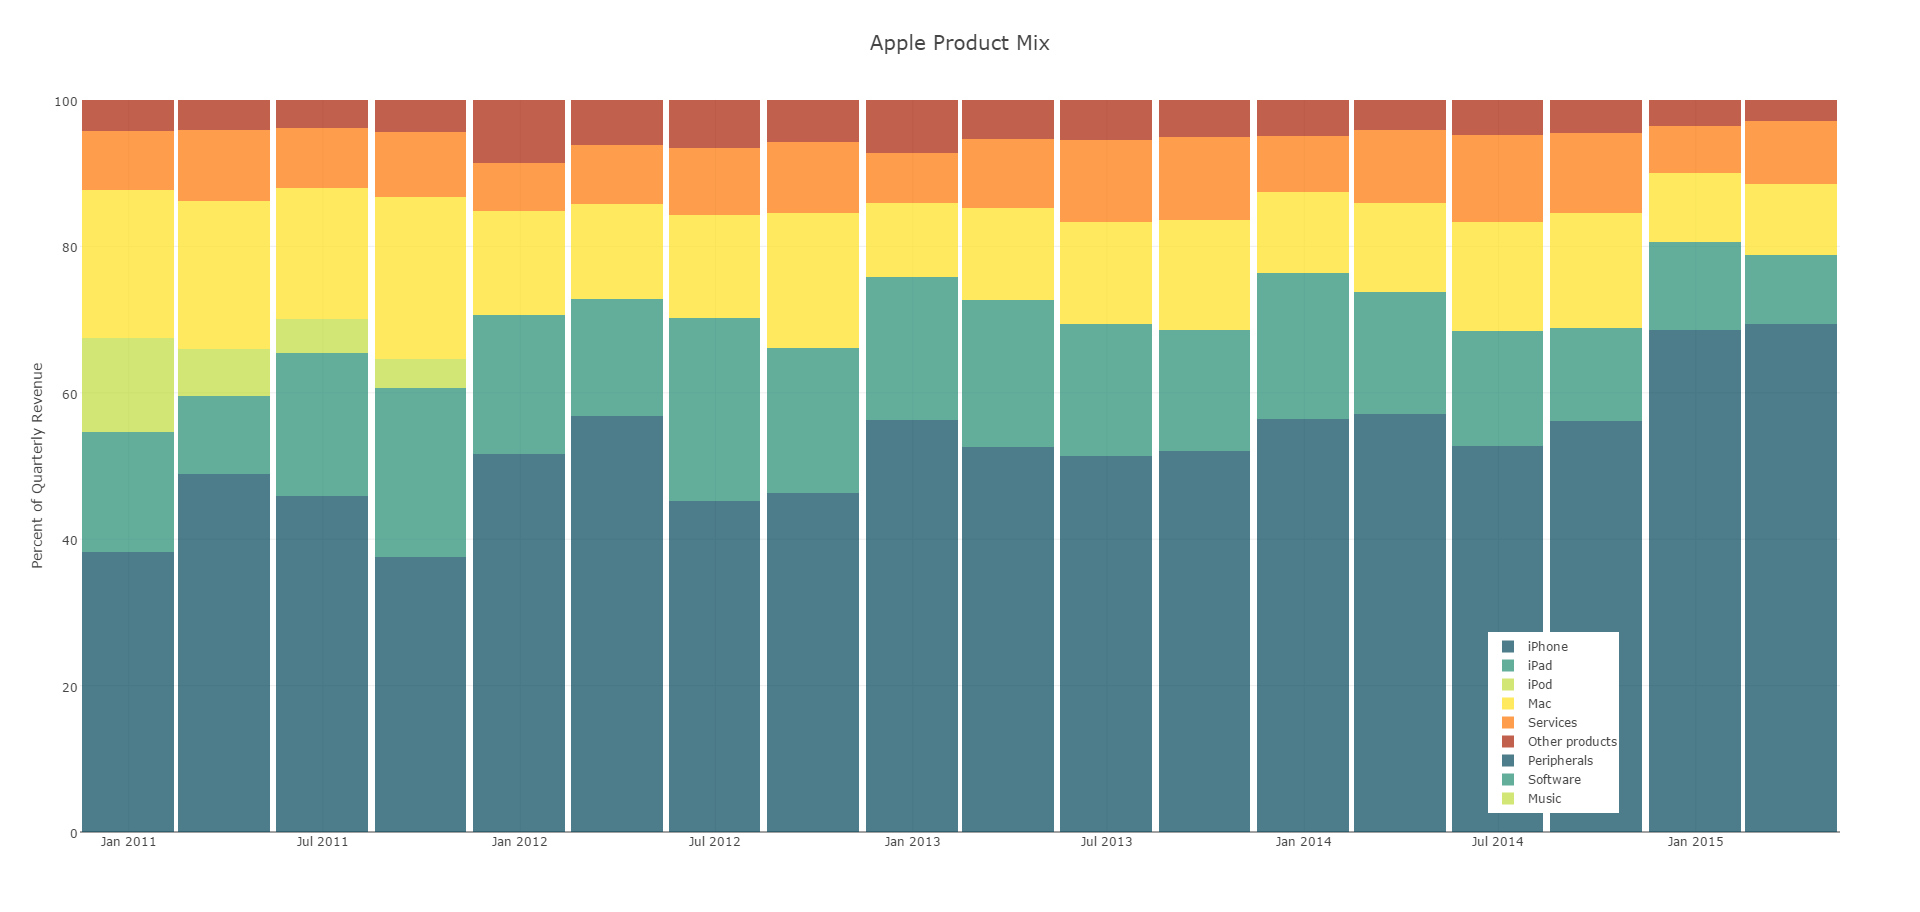
Chart Link: https://plot.ly/~krmarko/86/apple-product-mix/
Chart Author: @ kmarko
Touched up in: Plotly online editor
Code: Python code R Code
11. Did you read my long review yet? – Distributions of lengths of consumer reviews of Bounty, Viva, and Brawny
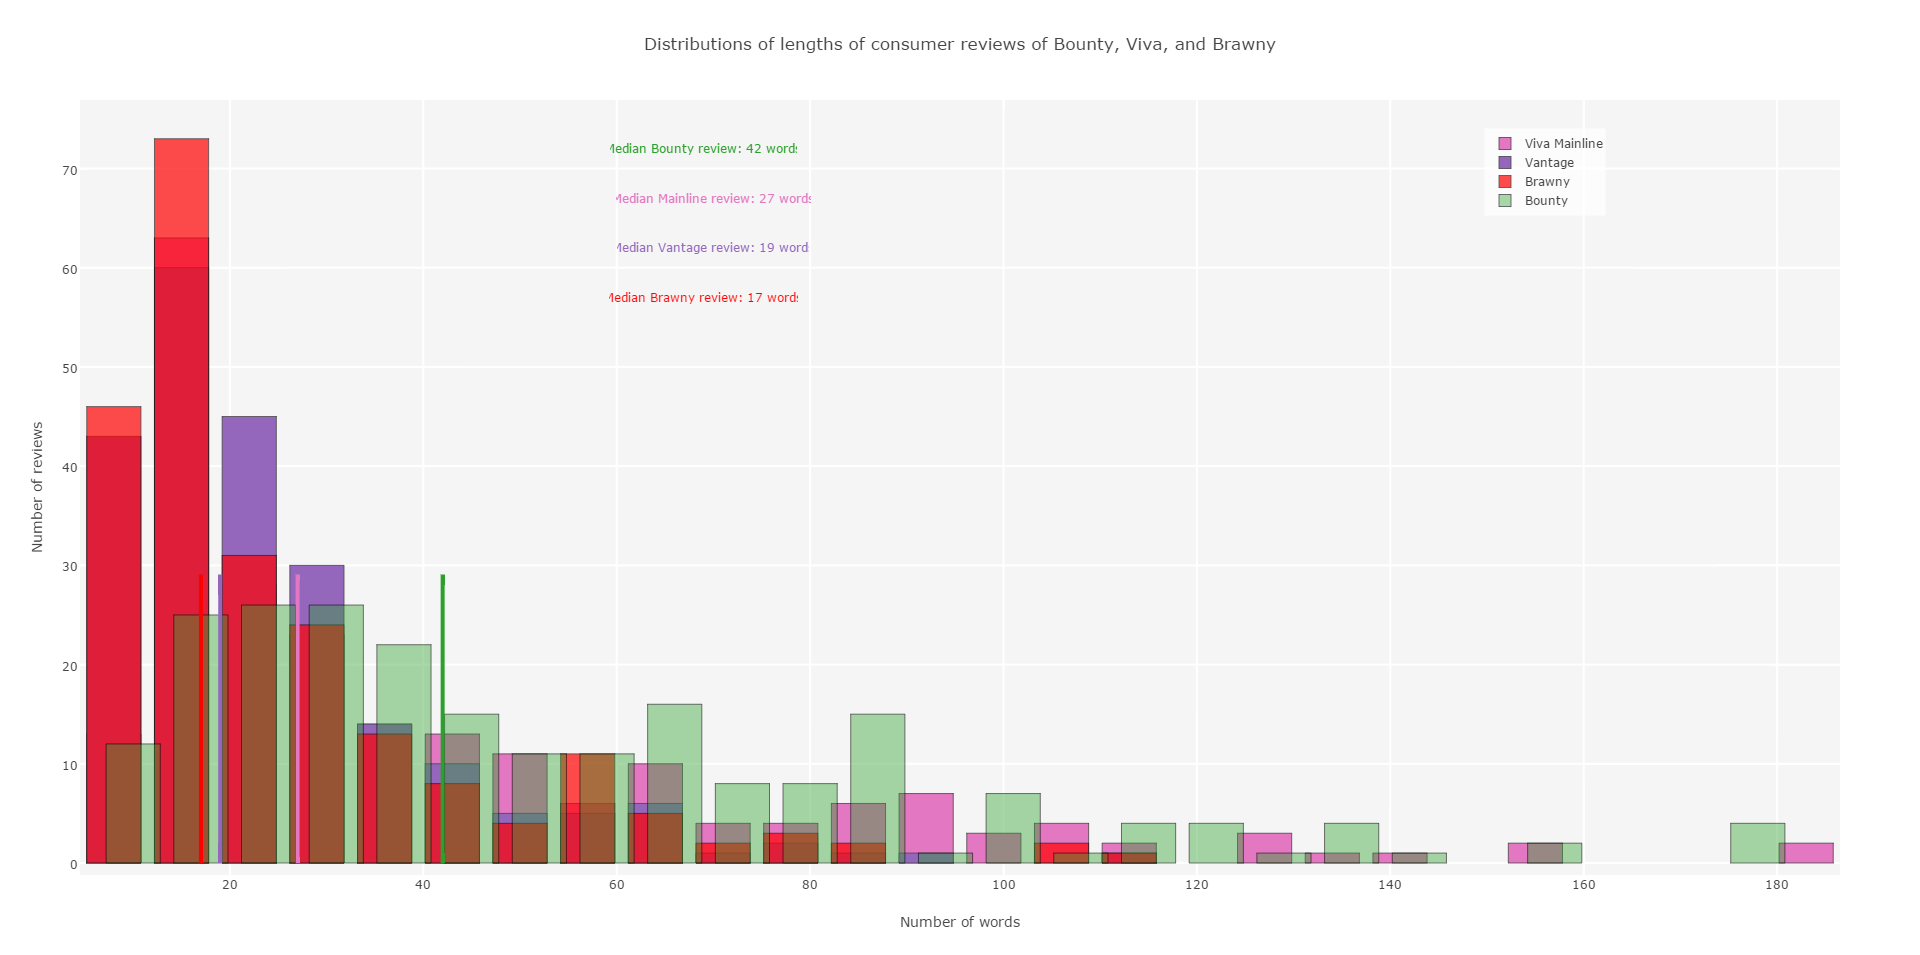
Chart Link: https://plot.ly/~EricBerry/180/distributions-of-lengths-of-consumer-reviews-of-bounty-viva-and-brawny/
Chart Author: @ EricBerry
Touched up in: Plotly online editor
Code: Python code R Code
12. Houston, I have a complaint – Types of Consumer Complaints
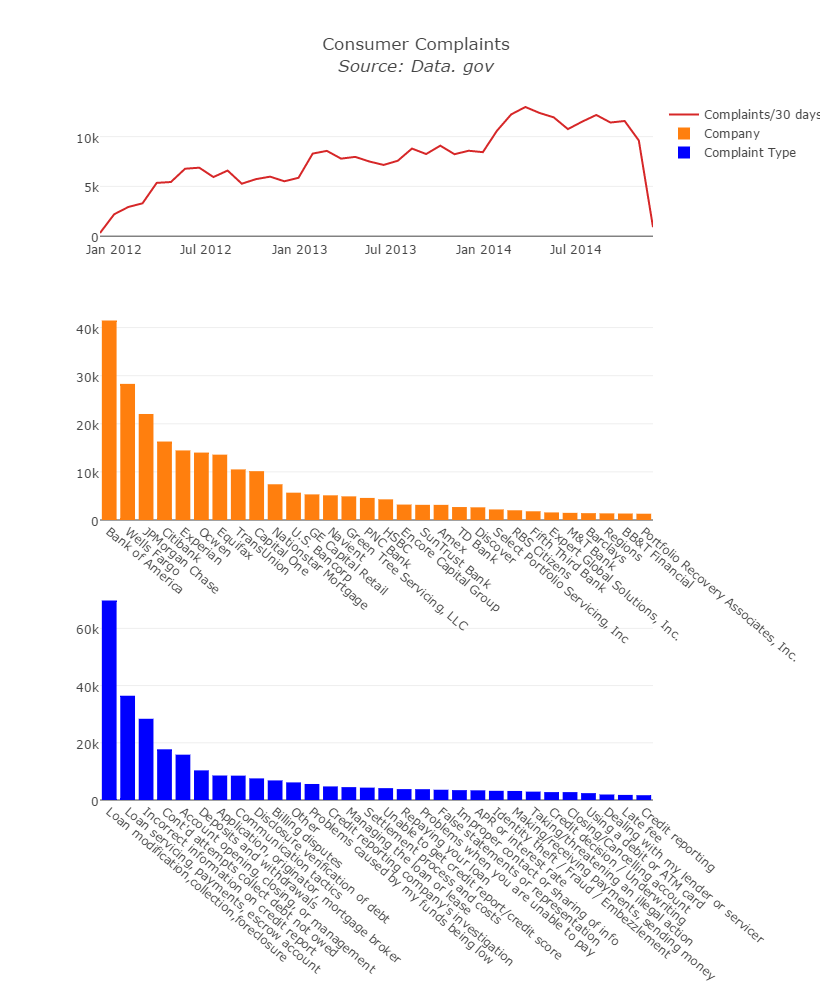
Chart Link: https://plot.ly/~MattSundquist/2316/consumer-complaints-source-data-gov/
Chart Author: @ MattSundquist
Touched up in: Plotly online editor
Code: Python code R Code
13. Juice !? Where’s my beer? – Declining consumer spending on alcohol in the US since mid-1980s
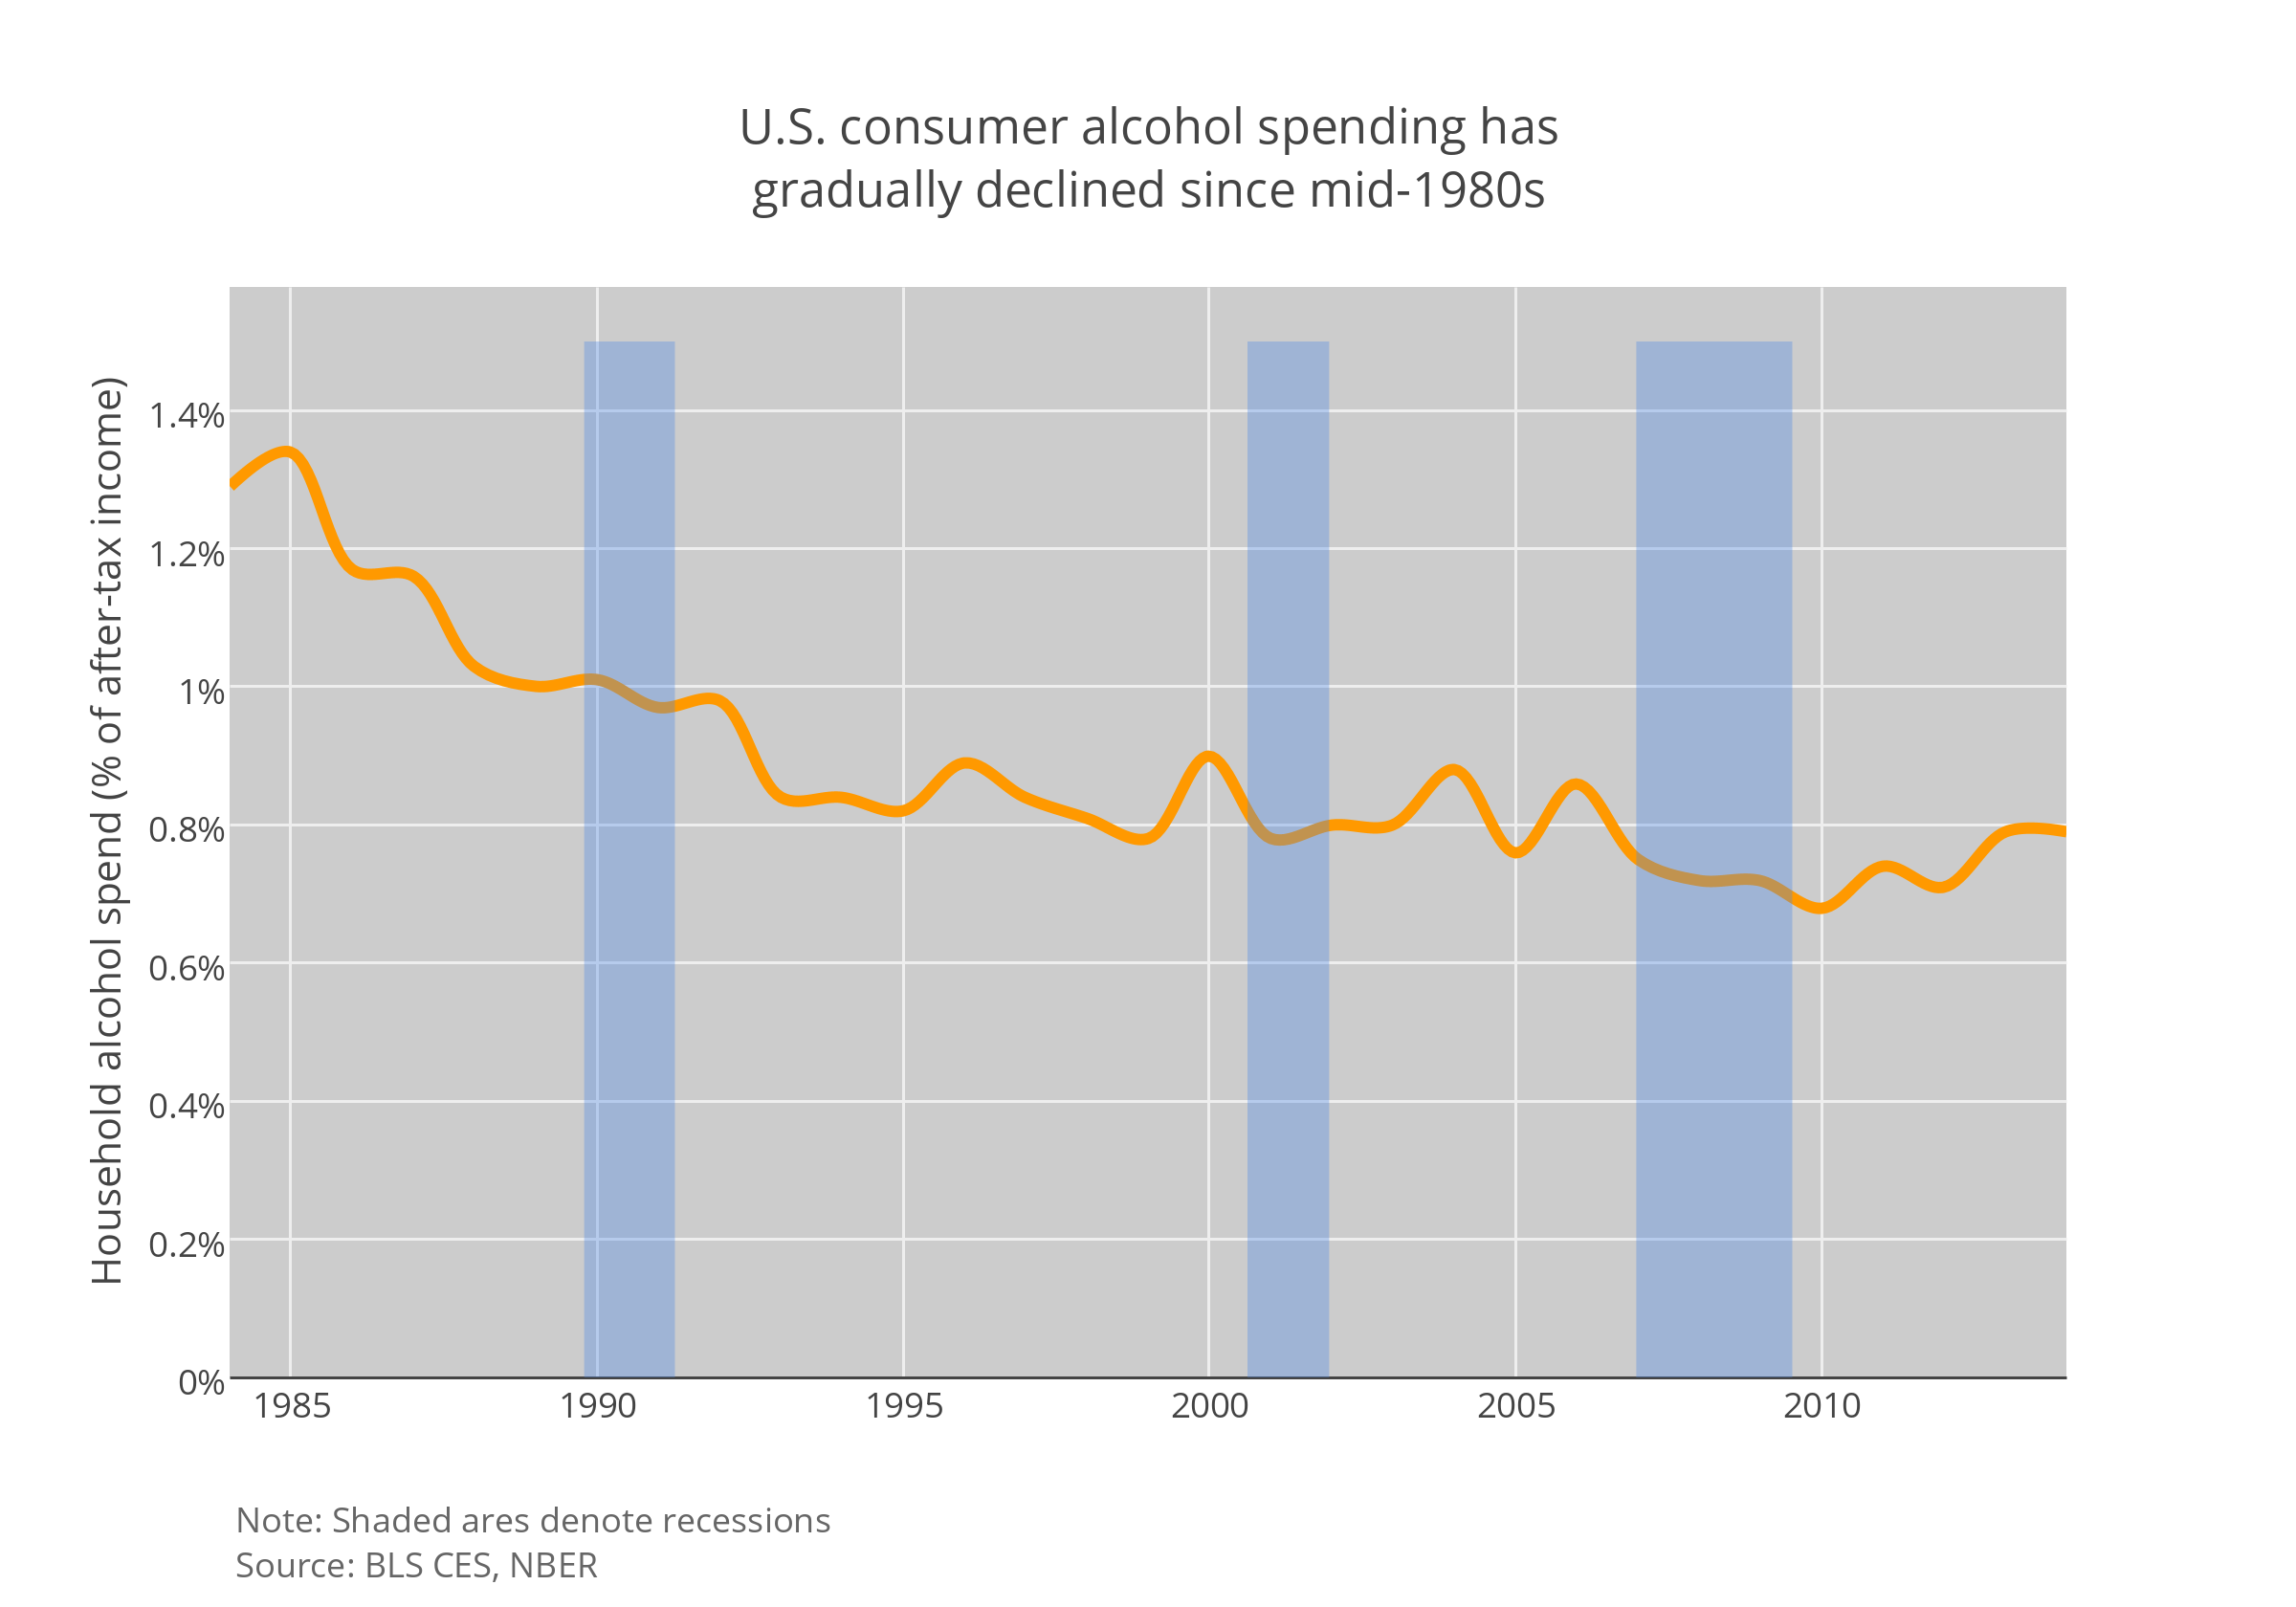
Chart Link: https://plot.ly/~mmester/101/us-consumer-alcohol-spending-has-gradually-declined-since-mid-1980s/
Chart Author: @ mmester
Touched up in: Plotly online editor
Code: Python code R Code
14. YIKES, that salad was expensive! – The Cost of Healthy Eating
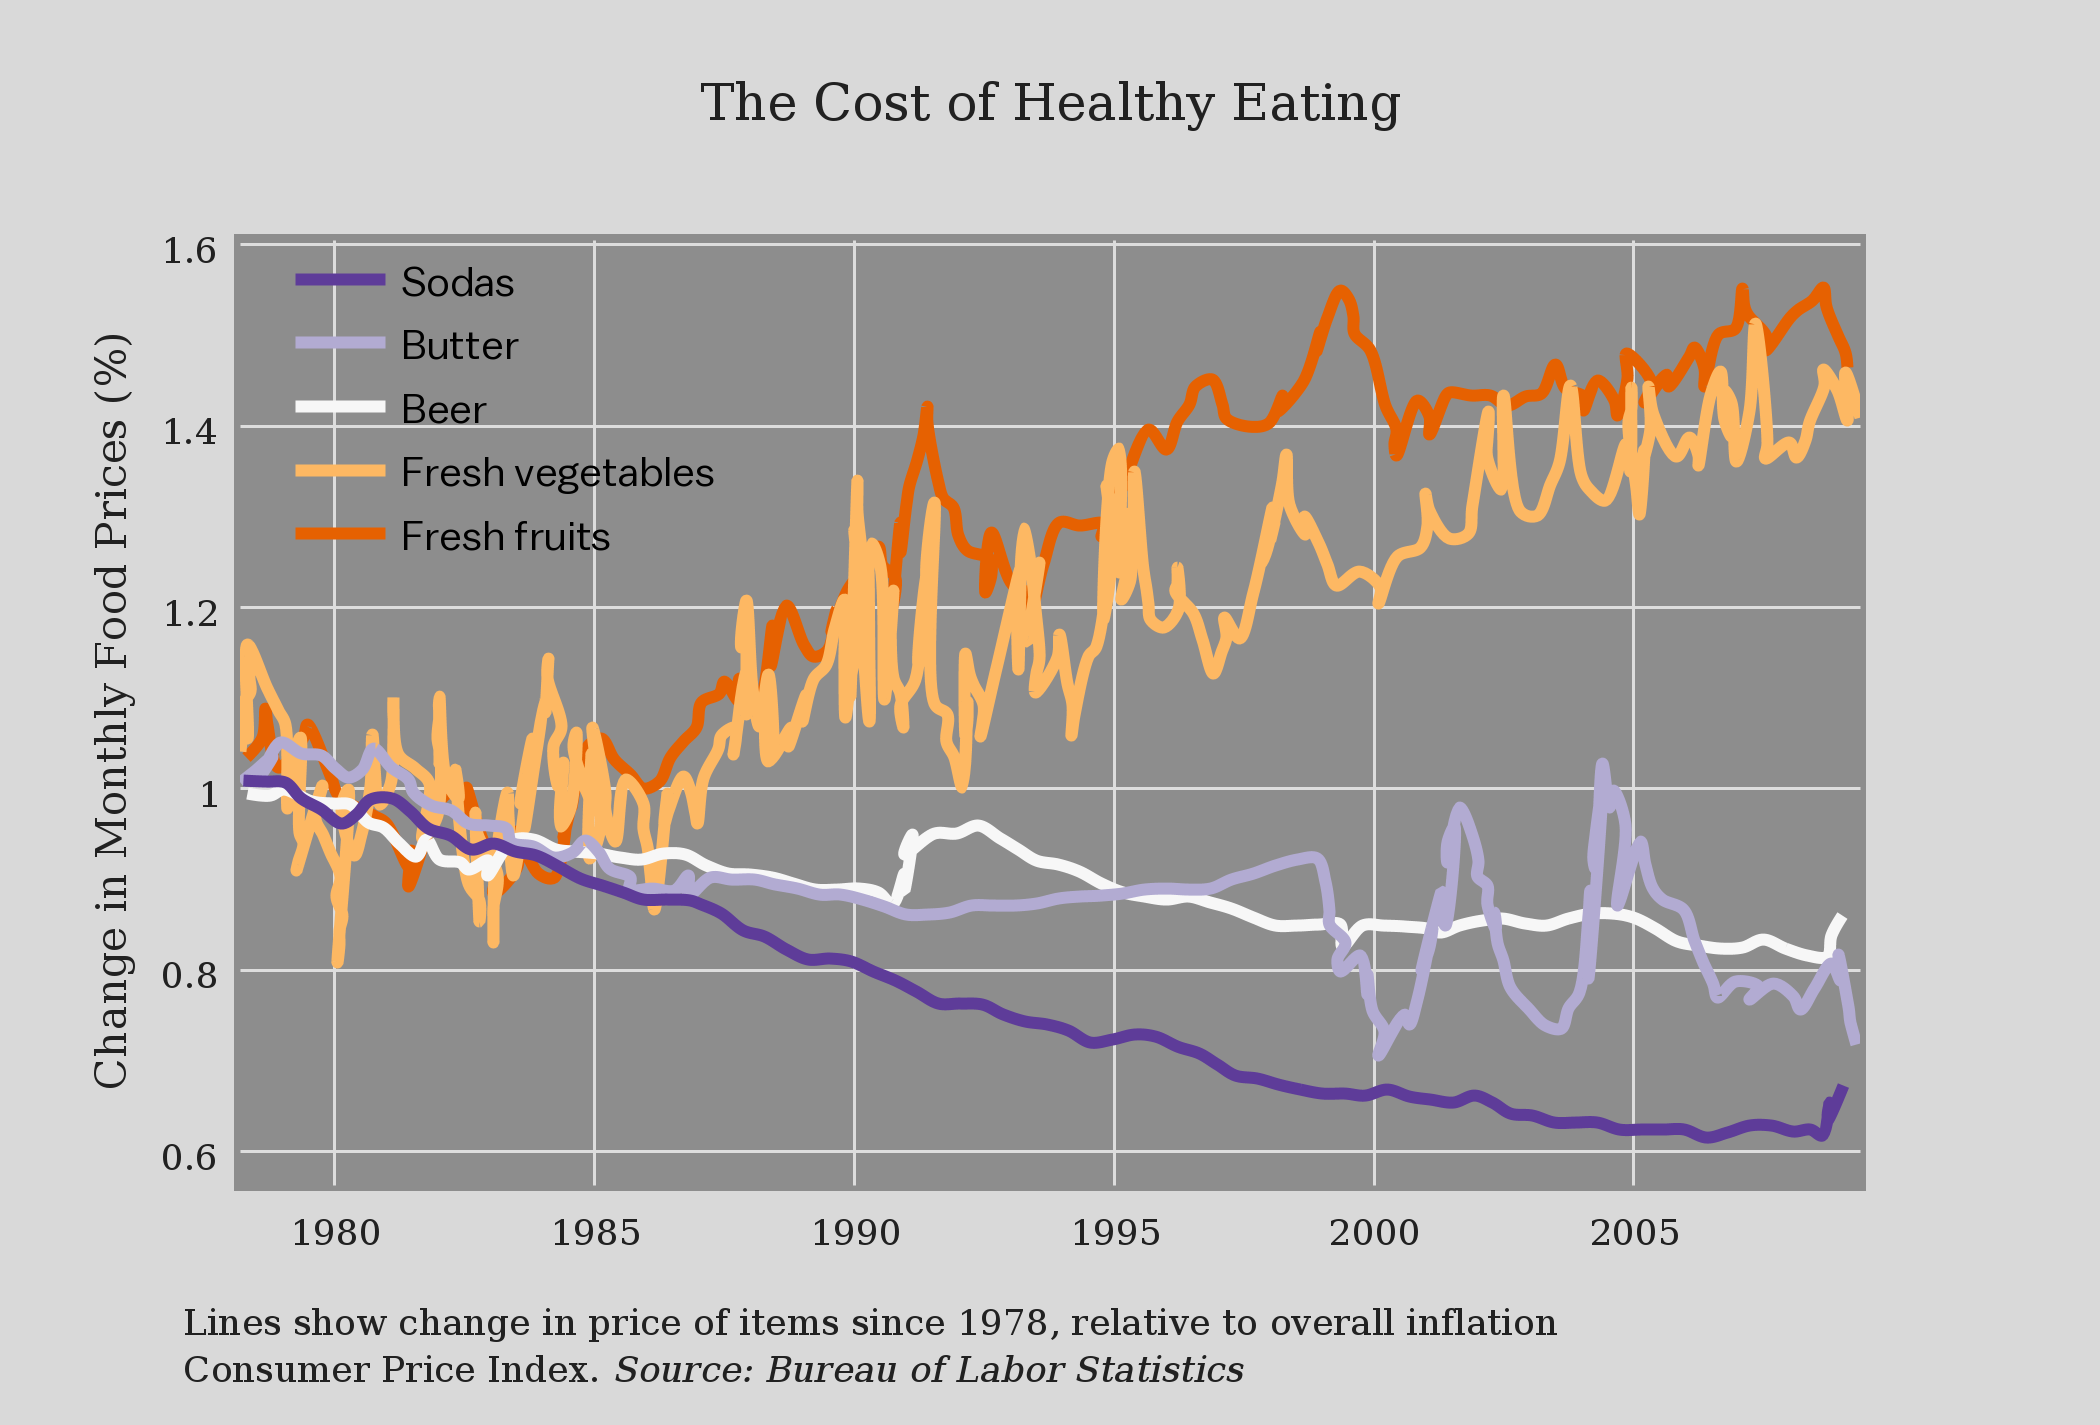
Chart Link: https://plot.ly/~Jackson/7/the-cost-of-healthy-eating/
Chart Author: @ Jackson
Touched up in: Plotly online editor
Code: Python code R Code
15. Whats this in my shampoo!? – Micro-Bead Sizes In Personal Care Products
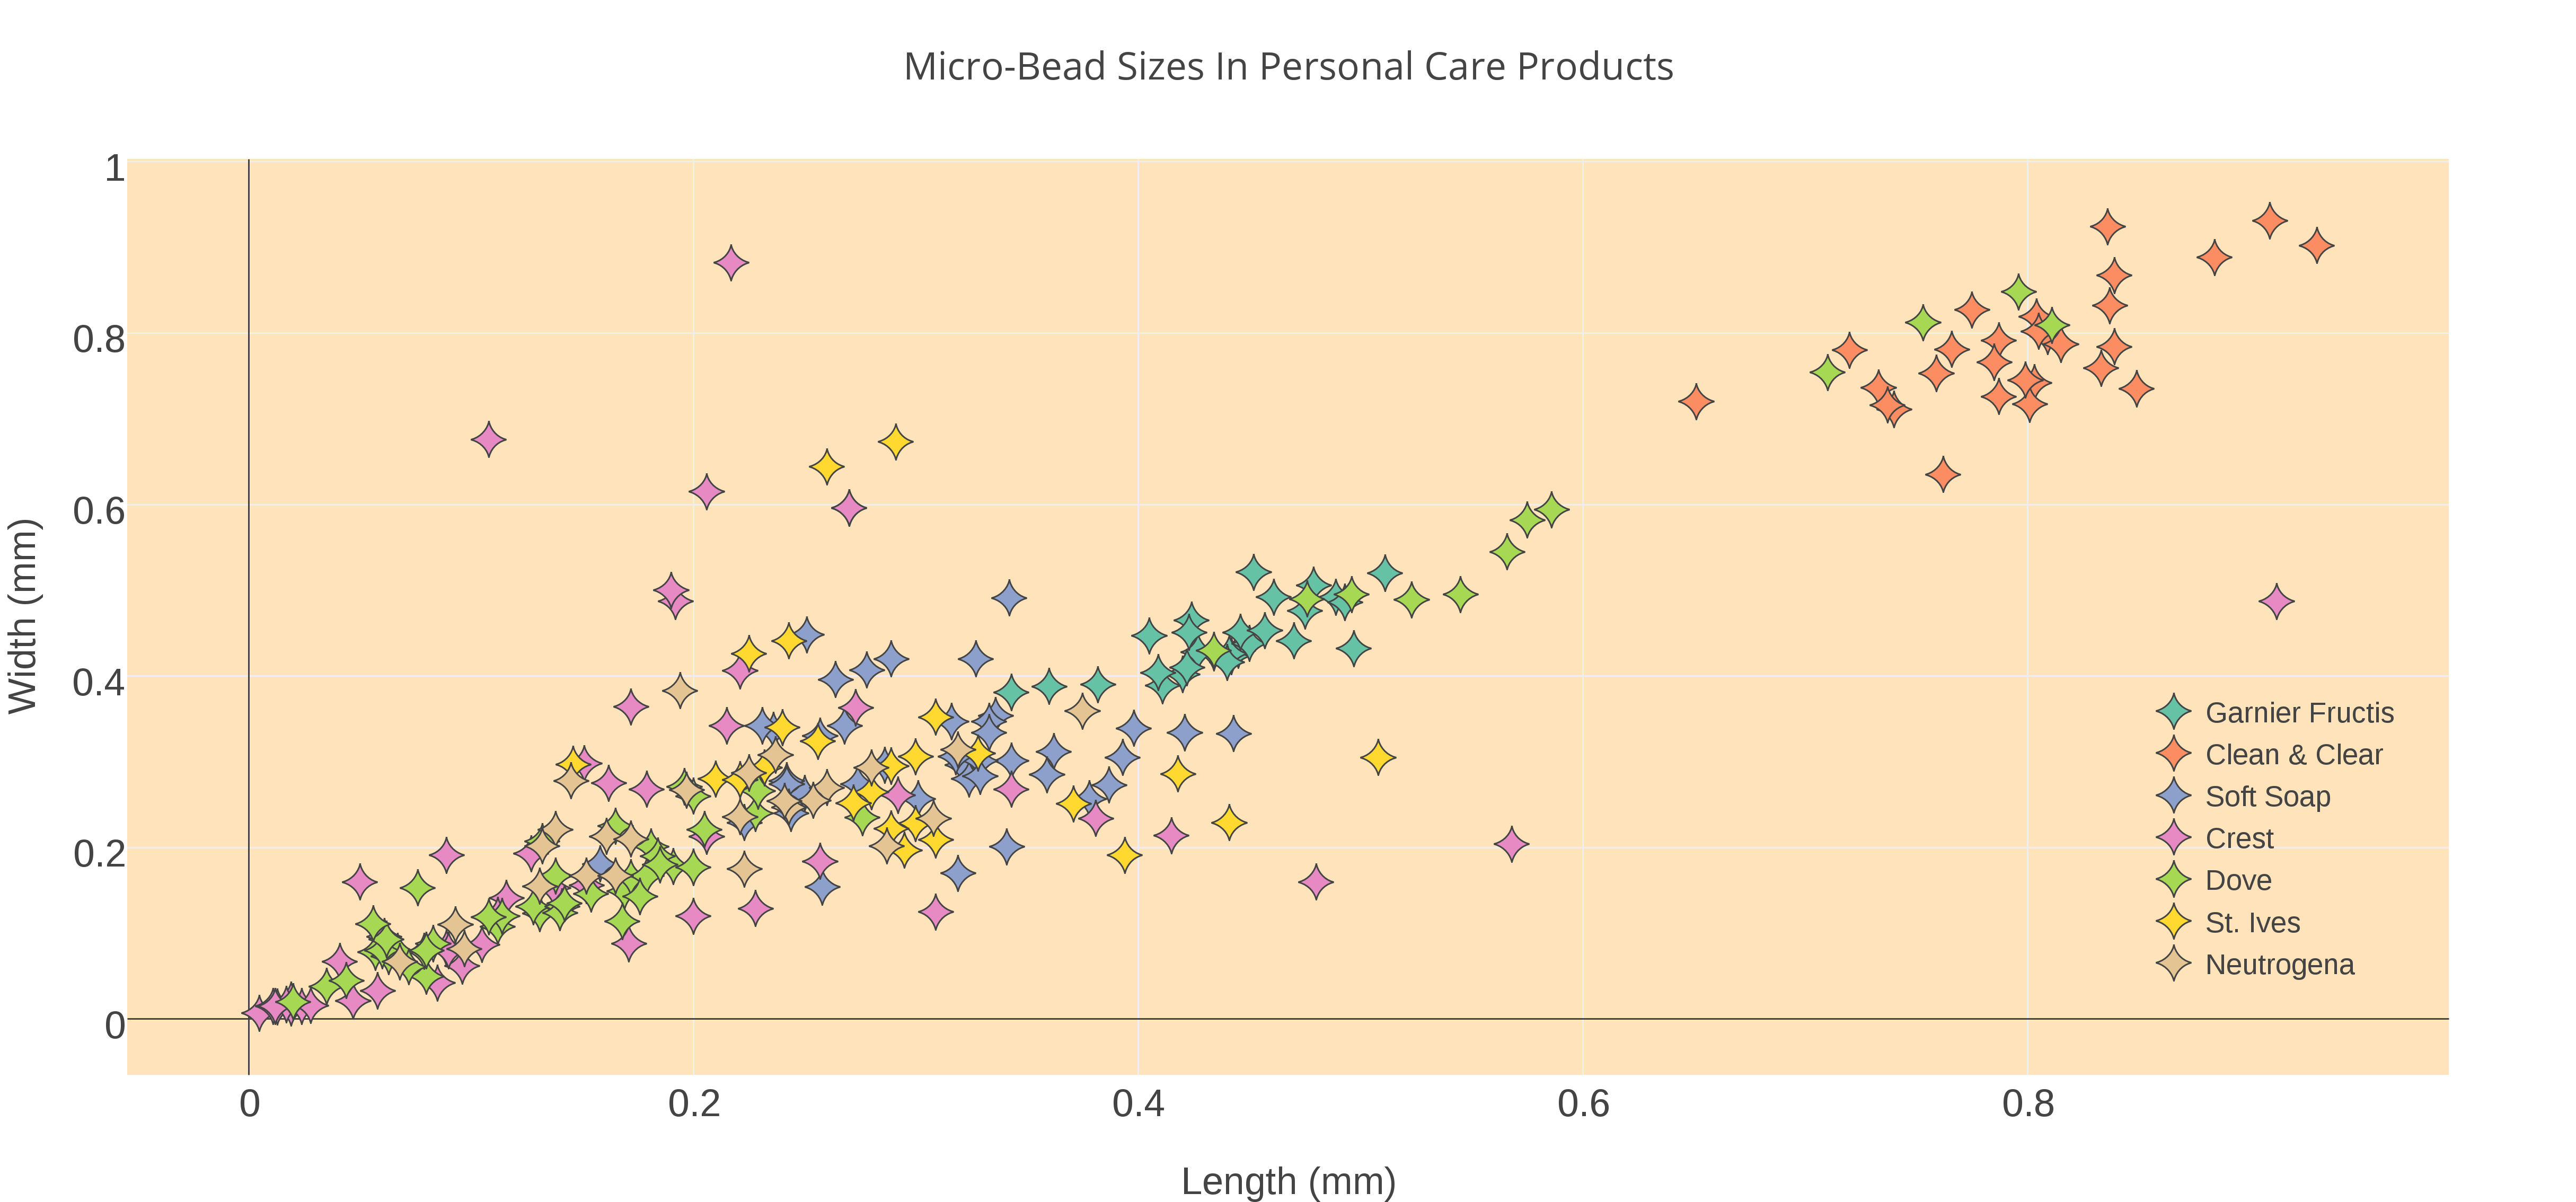
Chart Link: https://plot.ly/~jeremiah.feldstein/72/micro-bead-sizes-in-personal-care-products/
Chart Author: @ Jeremiah Feldstein
Touched up in: Plotly online editor
Code: Python code R Code