This is a reblog from the “Announcing Dash for R” announcement originally published July 10.
Dash, the fastest growing framework for building analytic web applications on top of Python models, is now available for the R programming language.
Installation | Documentation | GitHub | Gallery
Dash was released in 2017 as the latest evolution in Plotly’s open-source analytics tools. At the time, Plotly was known for our scientific charting libraries. (Plotly’s Python charting library, plotly.py, is downloaded more than one million times per month). Dash has enabled users of these charting libraries to expand their ideas from individual graphs to full-fledged, analytic applications run on powerful Python models.
Plotly was founded on the idea that the tools for scientific analysis were not keeping pace with 21st century innovations. Analysis ‘tools of the future’ would need to change significantly to support growing data and use case complexity. In particular:
- There would be a shift to interacting with data online, making the web browser the primary interface
- The core technology would be open-source and free, enabling greater sharing and faster innovation
- As global coding literacy increased, code-based analyses would supplant ones from point-and-click software
- Language agnostic coding tools would prevent duplicate effort and accelerate innovation
With this in mind, we’ve brought the power of Dash to R, making it possible to combine highly customizable user interfaces with R’s state-of-the-art statistical models and graphics.
Installation | Documentation | GitHub | Gallery
An open-source (MIT) license
Like almost all of Plotly’s software, the Dash for R package is MIT licensed. The MIT License is the most permissive of open-source licenses. It allows you to freely fork and modify the code, build and sell products with Dash for R, or embed Dash for R into a larger application — really anything you can imagine is A-OK 👌. You never have to contact us (though we’re happy if you do), reintegrate your code changes, or feel uneasy about xGPL repercussions down the road. Permissive licenses like MIT keep things simple. Watch and 🌟 star 🌟 the Dash for R Github repository to keep up with the latest developments.
Enhanced debugging experience
Dash Developer Tools is a standard feature of Dash. It helps to efficiently pinpoint errors, understand callback flow, and suggest syntax corrections. Even if you’re new to R, building your first Dash app is a breeze with Dash Dev Tools in your pocket. We want to make data analysis in R and Python fun and accessible to everyone — a first-class debugging experience is key to this. Dash Dev Tools was financially sponsored by a major US corporation but made available to all Dash users 👏. Please get in touch with us if there’s something you’d like to see added to the Dash corpus.
Scalable backend architecture
The state of your Dash app is the combination of all your user interface settings at any one time. Depending on your Dash app, the state might include which checkboxes are clicked, what text is in the search bar, which data in a graph is selected, etc.
Dash was designed with a stateless backend. This means that when your Dash app UI changes, the state of your app makes a round-trip to your R or Python code, but is never saved on the server. In fact, if you try to save the app state in your R or Python code, you’ll likely cause some strange behavior (see “Why global variables will break your app”).
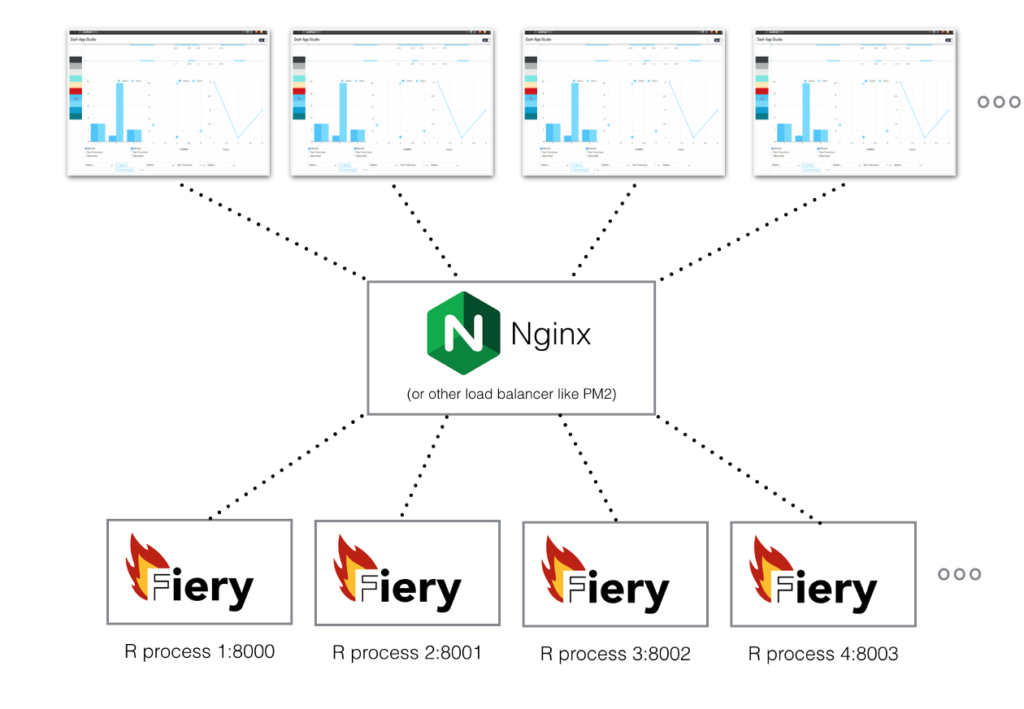
The killer advantage of a stateless backend is that multiple servers can easily power the same Dash app, because the state does not need to be shared across servers. Websites with high traffic volumes, such as the New York Times, can now publish interactive graphs powered by the statistical modelling capabilities because the number of Dash servers can easily scale to handle the computational load. Dynamic scaling can be achieved with a load balancer such as NGINX, or Plotly offers a high availability version of Dash Enterprise to handle dynamic scaling for you.
Pixel perfect styling
Dash ships with no default styling. This gives you a blank canvas to create your own look and feel per app. It’s usually impossible to discern a Dash app made in R from a full stack web application made by a team of developers. Behind the scenes, Dash creates a single page React application for you, but all you need to know is R to create it. Styling of Dash apps is achieved with standard CSS rules, so you can still use canned CSS libraries like Bootstrap, or collaborate with a designer to match your company’s brand. Dash Enterprise also comes with a styling kit that allows one-click theming of Dash apps and out-of-the-box mobile support for rapid productivity.
Seamless multi-page apps
Advanced analytic applications may have multiple pages. For example — a page to input model parameters, a page to view output graphs, and a page to export the results to PDF. Dash has powerful multi-page support so that your ideas are not confined to a single page or spread across multiple apps.
Interfaces for the life sciences
Software analytics tools have not kept pace with recent innovation in the life sciences. Companies and labs in synthetic biology, next generation sequencing, genomics, and biologics are developing their own tools to analyze the new formats and volumes of data that these fields produce. Dash Bio aims to be the most comprehensive, flexible, and efficient UI builder for life scientists working in R and Python. Dash Bio is fully compatible with the Dash for R package. View a gallery of Dash Bio sample apps (plus the R code to make them).
Modern React architecture
Developed and open-sourced by Facebook, React is the most popular JavaScript framework for building user interfaces. Dash users benefit from this ecosystem because there is a simple workflow for converting any React component into a Dash component with automatically generated R andPython interfaces. As the React component ecosystem continues to grow and flourish, the Dash component ecosystem expands as well.
R or Python…it doesn’t matter
Dash was designed from day one to be language agnostic, so teams can work in whatever language they prefer, and Dash’s future isn’t tied to a single analysis language. As a technology, Dash is 80% JavaScript and API design. The Python and R parts are relatively simple wrappers that interface to this API. You can likely expect Julia, Scala, and MATLAB support for Dash in the future.
Shout outs
Carson Sievert and Chris Parmer originally laid the foundations for bringing Dash to the R programming language. The web server in the Dash for R package (Fiery) was developed by Thomas Lin Pedersen. Dash, the Dash component libraries, and the Dash graphing libraries are maintained by a team of 20 open-source developers in the AI and research capital of Canada — Montréal.